Download
1 / 4
40 likes | 147 Vues
In 2013, Arizona's restaurant scene boasts over 9,000 locations, contributing 11% to the state workforce and generating more than $10 billion in annual sales. Notable trends include the farm-to-table movement, which emphasizes locally sourced ingredients and healthier options. Restaurants are also extending dayparts and focusing on smaller, appetizer-style dishes to enhance customer experience and boost traffic. Despite a decline in monthly dine-out rates, Phoenix adults frequently visit fast-food establishments, with Mexican cuisine remaining the most popular choice.

E N D
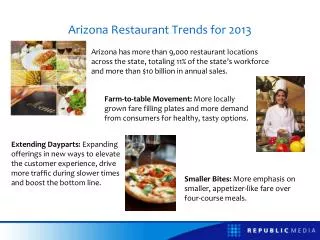
Arizona Restaurant Trends for 2013 Arizona has more than 9,000 restaurant locations across the state, totaling 11% of the state’s workforce and more than $10 billion in annual sales. Farm-to-table Movement: More locally grown fare filling plates and more demand from consumers for healthy, tasty options. Extending Dayparts: Expanding offerings in new ways to elevate the customer experience, drive more traffic during slower times and boost the bottom line. Smaller Bites: More emphasis on smaller, appetizer-like fare over four-course meals.
The volume of Phoenix adults who patronize restaurants each month has declined from 2012, but the frequency with which they visit fast-food establishments has increased in 2013. In 2013, the most popular type of restaurant among Phoenix adults continues to be Mexican. Source: 2012-2013 Phoenix CBSA Scarborough Release 1 (Feb. 11 – Jan. 13)
Compared to the total Phoenix adult market, those who patronize fast-food or full-service restaurants each month are more digitally dependent. How to Read: Phoenix adults who patronized a full-service restaurant in the past month are 8% more likely to own a tablet than the average Phoenix adult. Source: 2013 Phoenix CBSA Scarborough Release 1 (Feb. 12 – Jan. 13)
Compared to the total market, Phoenix adults who ate at a full-service restaurant in the past month are 8% more likely to visit azcentral.com each week. Phoenix adult population index is 100 How to Read: An index demonstrates what is above average (101 or greater), average (100), and below average (99 or less) of a given demographic. Source: 2013 Phoenix CBSA Scarborough Release 1 (Feb. 12 – Jan. 13)