Download

1 / 34
340 likes | 568 Vues
Climate, Climate Change Nuclear Power and the Alternatives. Climate, Climate Change Nuclear Power and the Alternatives. PHYC 40050 Peter Lynch Meteorology & Climate Centre School of Mathematical Sciences University College Dublin. Lecture 8. Climate Change and Wind Energy

E N D
Climate, Climate Change Nuclear Power and the Alternatives
Climate, Climate Change Nuclear Power and the Alternatives PHYC 40050 Peter Lynch Meteorology & Climate Centre School of Mathematical Sciences University College Dublin
Lecture 8 Climate Change and Wind Energy [Based in part on PhD work of Paul Nolan] Supervisor: Peter Lynch
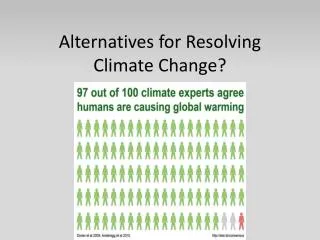
Overview Greenhouse gas emissions are having a significant effect on the Earth’s climate. Globally, the 11 of the 12 warmest years on record were in the 1990s and 2000s.
Overview Temperatures in Ireland have mirrored this global trend Changes in the wind climatology are expected New increased target of 40% of electricity from renewable resources by 2020 It is vital to model the impact of climate change on future wind patterns over Ireland.
Wind Energy – the next 50 years • 50 year world outlook: context population stablized or declining, oil and gas running out, coal restricted, nuclear? • Nearer term oil limited to transport sector • Global energy demand and resources of renewables available.
ESTIMATED LAND WIND RESOURCES The world’s wind resources are about 53,000 TWh/year. Australia 3,000 North America 14,000 Latin America 5,400 Western Europe 4,800 Eastern Europe and former Soviet Union 10,600 Rest of Asia 4,600 Africa 10,600 Ref: Windforce 12 Greenpeace Source: Wind resources from Michael Grubb and Niels Meyer, 1994
Offshore Wind Farm Arklow Bank
European average wind power generation between 1965 and 1998, over 60 well-distributed sites Ref: G.Giebel
Wind On land: Range 30 euro1 to 80 euro2 per MWh Wind Offshore: Range 90 euro3 to 110 euro per MWh Nuclear 43 euro4 and 54.3 euro5 per MWh Stern Review: 58 to 52 euro Sustainable Development Commission, UK: 33.9 to 51.6 euro References 1. Airtricity US 4. UK Energy Review July 2006 Nuclear Cost Benefit 2. Germany 5. UK Energy Review Synthesis of Cost Benefit Analysis July 2006 3. Current North Sea Wind versus Nuclear Costs
The impact of greenhouse gases on climate change can be simulated using Global Climate Models The typical resolution of Global models is 50km or greater Modelling the Winds Global Model to Regional Model • We are using a Regional Climate Model (RCM) to dynamically downscale the coarse information from the global models.
The IPCC Green house Gas Emission Scenarios Total global annual CO2 emissions from all sources from 1990 to 2100 (in gigatonnes of carbon (GtC/yr))
CLM Experiment Setup • 90*94 grid boxes → resolution of 7 km • Global → CLM 18km → CLM 7km • Wind fields output every hr • 32 vertical levels • Validation run: • ERA-40; 1981-2000 • Future Projections: • ECHAM 2021-2060 A1B CLM Model Domain
CLM Setup The CLM 7km simulations were run on the ‘Stokes’ Linux cluster at the Irish Centre for High-End Computing (ICHEC) Each compute node has two Intel Xeon E5462 quad-core processors and 16GB of RAM. See http://www.ichec.ie
Validation of the CLM Regional Climate Model The CLM was validated by performing a 20-year climate simulation (1981-2000) ERA-40 and ECHAM5 boundary data were used We compared the results with observations and ERA-40 data
At each grid point (i,j) we fit a Weibull distribution Weibull Distribution Birr Observatory: Buoy 60km West of Galway
CLM Validation at Casement Station (1981-2000) Observed CLM ERA 18km CLM ERA 7km CLM ECHAM5 7km
RCA Future Climate Projections 2021-2060 ANNUAL (A1B, A2, B1 & B2) Scenarios
CLM Future Climate Projections Winter A1B Scenario (2021 – 2060) % Change in 60m Mean Wind Speed % Change in 60m Mean Wind Power
RCA Future Climate Projections 2021-2060 Winter (A1B, A2, B1 & B2) Scenarios
CLM A1B Scenario Winter Projections:Probability of wind speeds between 4m/s and 25m/s Past Future
RCA A2 Scenario Winter Projections:Probability of wind speeds between 4m/s and 25m/s Past Future
The method of Regional Climate Modelling was used to simulate the wind climatology of Ireland at high spatial resolution. The models were validated by performing past simulations of the Irish climate and comparing the results to observations. Projections for the future Irish climate were generated by downscaling for a reference period 1961-2000 and future period 2021-2060 Results show an overall increase in mean wind speeds for the future winter months and a decrease during the summer months. The projected changes for summer and winter were found to be statistically significant over most of Ireland. Summary & Conclusions