Download
1 / 1
10 likes | 361 Vues
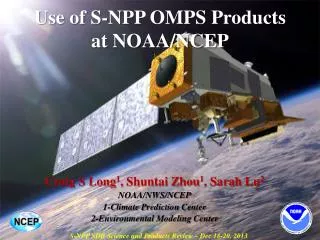
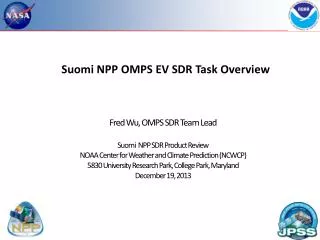
NPP Product Validation for the Ozone Mapping and Profiler Suite (OMPS) L. Flynn 1 , I. Petropavlovskikh 2 , D. Swales 3 , J. Niu 4 , E. Beach 3 , W. Yu 4 , C. Seftor 5 , and C. Long 1

E N D
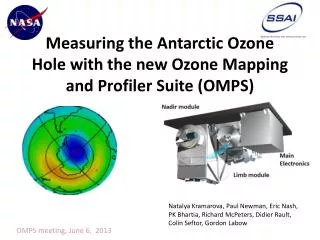
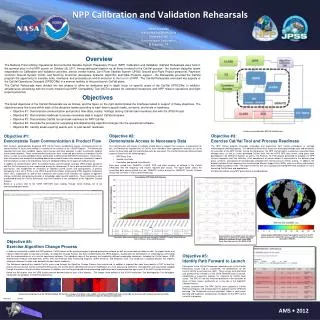
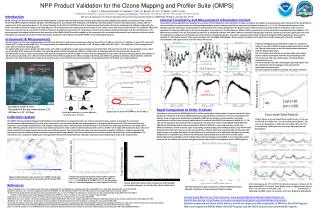
NPP Product Validation for the Ozone Mapping and Profiler Suite (OMPS) • L. Flynn1, I. Petropavlovskikh2, D. Swales3, J. Niu4, E. Beach3, W. Yu4, C. Seftor5, and C. Long1 1NOAA/NESDIS, 5200 Auth Rd., Camp Springs MD 20734 US Lawrence.E.Flynn@noaa.gov, 2CIRES Boulder CO, 3IMSG Kensington MD, 4ERT Laurel MD, and5SSAI Lanham MD. 8th Annual Symposium on Future Operational Environmental Satellite Systems, AMS New Orleans, January 25, 2012 Introduction Internal Consistency and Measurement Information Content • NOAA, through the Joint Polar Satellite System (JPSS) program, in partnership with National Aeronautical Space Administration (NASA), launched the Suomi National Polar-orbiting Partnership (NPP) satellite on October 28, 2011. The JPSS program is executing the NPP Calibration and Validation (Cal/Val) program to ensure the data products comply with the requirements of the sponsoring agencies. The Ozone Mapping and Profiler Suite (OMPS) consists of two telescopes feeding three detectors measuring solar radiance scattered by the Earth's atmosphere and solar irradiance by using diffusers. The measurements are used to generate estimates of total column ozone and vertical ozone profiles. The validation efforts will make use of external resources in the form of ground-based and satellite measurements for comparisons and internal consistency methods developed over the last thirty years. This poster provides information on the state of the execution of the OMPS Cal/Val Plan with emphasis on the measures of the instrument performance from internal consistency analysis techniques and comparisons to other satellite instrument products for the validation of the NPP OMPS environmental data products. The product retrieval algorithms are designed to use ratios of Earth radiance to solar irradiance, to make use of pairs and triplets of measurements, and in the case of the Limb profiler to use normalization to measurements at reference tangent heights, greatly reducing sensitivity to instrument throughput changes [3, 4, 5, 6, 7, 8]. The hyperspectral nature of the detectors provides information at wavelengths not used directly in the retrieval algorithm. Residuals for these measurements are used to check the consistency of the retrieved quantities. For example, differences in the ozone absorption cross section for channels between 305 and 310 nm provide a test of the retrievals for equatorial viewing conditions. The differential sensitivity of the top of atmosphere radiances at reflectivity channels from 340 to 360 nm to satellite viewing angles and solar zenith angles provide opportunities to check the calibration by comparisons of derived cross track minimum reflectivity estimates. Covariance analysis combined with empirical orthogonal function generation will be used to evaluate the information content of the measured spectra for the OMPS Nadir Mapper. Similar analysis has been used to identify intra-orbit wavelength scale drift, stray light contamination, and signal-to-noise levels for other UVB sensors. Instruments & Measurements The total column sensor uses a single grating and a CCD array detector to make measurements every 0.42 nm from 300 nm to 380 nm with 1.0 nm resolution. It has a 110 cross-track FOV and 0.27° along-track slit width FOV. The measurements are combined into 35 cross-track bins: 3.35° (50 km) at nadir, and 2.84° at ±55°. The resolution is 50 km along-track at nadir, with a 7.6-second reporting period. The nadir profile sensor uses a double monochromator and a CCD array detector to make measurements every 0.42 nm from 250 nm to 310 nm with 1.0-nm resolution. It has a 16.6° cross-track FOV, 0.26° along-track slit width. The reporting period is 38 seconds giving it a 250 km x 250 km cell size collocated with the five central total column cells. The limb profile sensor is a prism spectrometer with spectral coverage from 290 nm to 1000 nm. It has three slits separated by 4.25° with a 19-second reporting period that equates to 125 km along-track motion. The slits have 112 km (1.95°) vertical FOVs equating to 0 to 60 km coverage at the limb, plus offsets for pointing uncertainty, orbital variation, and Earth oblateness. The CCD array detector provides measurements every 1.1 km with 2.1 km vertical resolution. The products for the Limb Profiler are not discussed here. Empirical Orthogonal Covariance (EOF) analysis of a covariance matrix for an orbit of GOME-2 measurements from 320 nm to 340 nm. The top three panels on the left show the spectral patterns with the largest eigenvalues. The first matches well with the ozone absorption cross section pattern and the coefficients show the expected changes with cross-track view and solar zenith angles, and the latitudinal distribution of ozone. The third matches well with a wavelength scale shift pattern and the coefficients track the changes in the optical bench temperature along and orbit. The second pattern is difficult to classify but may be related to the temperature dependence of the ozone absorption. Ozone Absorption Nadir Profiler Temperature or Reddening Solar Lines Solar Irradiance Wavelength Scale Shift EOF Patterns Main Electronics Limb Profiler (by Ball Aerospace & Technology Corp.) Earth Radiance Ozone Absorption Features EOF Coefficients by BATC Radiance/Irradiance Ratio Instrument Fields of View. The limb FOV has been reduced from 2.23° (130 km) to 1.95° (112 km). Rapid Comparison to Other Products Typical spectra from 310 to 400 nm for GOME-2. Each instrument has two solar diffusers; a working and a reference. The ozone products from the OMPS Nadir Profiler will be compared to similar products from the operational Solar Backscatter Ultraviolet instruments (SBUV/2) and ground-based Dobson and Brewer instruments operated in the Umkehr mode. Comparisons will start by including the OMPS NP zonal means of ozone profiles and initial measurement residuals in the currently monitored set of results for the SBUV/2 instruments on NOAA-16, -17 -18, and -19. Of particular interest will be those computed for instruments in similar orbits (NOAA-19 and NOAA-18 SBUV/2s) at all latitudes and for those computed for NOAA-17 SBUV/2 in a morning orbit for no-local-time difference latitudes. (If one examines a pair of ascending and descending polar-orbiting satellites, they will find two latitudes where the nadir views are at the same local time of day for both. One on the day side and the other 180 degrees away on the night side with a 12-hour difference in local time.) For the OMPS Nadir Mapper, we will make comparisons of its global ozone, effective reflectivity and aerosol products to similar ones from the Ozone Monitoring Instrument (OMI) and to the Global Ozone Monitoring Experiment (GOME-2). Sets of overpass match up values for the satellite instruments with ground-based locations will be expanded to include OMPS products. Calibration System Weekly Means of 1-percentile Effective Reflectivity (at 331 nm) for MetOP-A GOME-2 for a box in the Equatorial Pacific. The cross-track dependence is believed to be produced by an error in the absolute calibration and scan-angle-dependent mirror degradation. Effective Reflectivity, % The OMPS instruments (Nadir Mapper, Nadir Profiler, and Limb Profiler) are designed to take a set of measurements to allow analysts to maintain the instrument characterization and calibration.[2] For each of the instruments, this task can be broken into two components, tracking the performance of the CCD array detectors and electronics, and tracking the performance of the optical components, that is, the telescopes and spectrometers. The instruments make measurements on the night side of orbits with the apertures closed. One set is made without any sources and is used to track the CCD array dark currents. Another set is made with illumination by an LED and is used to track CCD non-linearity and pixel-to-pixel non-uniform response. The instruments also make solar measurements using pairs of diffusers. Judicious operation of working and reference diffusers allows analysts to track the diffuser degradation. The solar measurements also provide check on the wavelength scale and bandpass. The instruments have completed multiple passes through their internal dark and nonlinearity calibration sequences and are beginning to make solar measurements. Diffuser Entrance Aperture Total Column Ozone, DU Entrance Aperture |Lat|<10 Lon<-100 4% Total Column Ozone, DU Difference in Percent Earth Sun Cross-track View Position Comparison of daily mean total column ozone estimates from NOAA-18 SBUV/2 (BLACK), NOAA-19 SBUV/2 (GREEN) and MetOP-A GOME-2 (BLUE) for December 2011 for a latitude/longitude box in the Equatorial Pacific. Map of South Atlantic Anomaly effects on OMPS closed-door dark current measurements in December and November 2011. Brewer Daily Total Column Ozone Comparison with Daily OMI for the Table Mountain Test Facility 2011-10-04 to 2012-01-04 Daily zonal means for 20ºS to 20ºN for initial measurement residuals for the operational SBUV/2 Version 8 ozone profile retrieval algorithm for the last three years for three wavelengths. The NOAA-19 SBUV/2 instrument has undergone multiple recharacterizations of its time-dependent degradation. References Monthly Total Column Ozone comparisons between SBUV/2 overpass data and a collection of 30 ground-based Dobson stations [1] Juan V. Rodriguez, et al., “An overview of the nadir sensor and algorithms for the NPOESS ozone mapping and profiler suite (OMPS),” Proc. SPIE, 4891, April 2003, DOI: 10.1117/12.467525. [2] Quinn P. Remund, et al., “The ozone mapping and profiler suite (OMPS): on-orbit calibration design,” Proc. SPIE, 5652, pp.165-173. December 2004, DOI: 10.1117/12.579016. [3] Earth Science Satellite Remote Sensing Vol.1: Science and Instruments, Qu, J.J.; Gao, W.; Kafatos, M.; Murphy, R.E.; Salomonson, V.V. (Eds.), 2006, Springer Verlag, ISBN: 978-3-540-35606-6. “Chapter 21: Introduction to the Ozone Mapping and Profiler Suite (OMPS),” L. Flynn, C. Seftor, J. Larsen, and P. Xu, Springer Verlag, July 2004. [4] Flittner, D.E., et al., O3 profiles retrieved from limb scatter measurements: Theory, Geophys. Res. Lett., 27, 2061-2064, 2000. [5] McPeters, R. D., et al., Nimbus-7 Total Ozone Mapping Spectrometer (TOMS) Data Product’s User’s Guide, NASA Reference Publication 1384, National Aeronautics and Space Administration, Washington, DC, 1996. [6] Bhartia, P.K., et al., “Algorithm for the estimation of vertical profiles from the backscattered ultraviolet technique,” J. Geophys. Res. 101, 18,793-18,806, 1996. [7] D. Rault, R. Loughman and G. Taha, Data analysis and retrieval algorithms for the ozone mapping and profiler suite/limb profiler instrument. Proceedings of the SPIE, Vol. 7107, 19 pp. 71070T-71070T-12, doi: 10.1117/12.800672. [8] Solar Backscatter Ultraviolet Instrument (SBUV/2) Version 8 Ozone Retrieval Algorithm Theoretical Basis Document (V8 ATBD), Edited by L. Flynn (Last Revision February 2, 2007) [9] Lee, TF; Nelson, CS; Dills, P; et al., NPOESS Next-Generation Operational Global Earth Observation, Bulletin of the American Meteorological Society 91(6), 2010 DOI: 10.1175/2009BAMS2953.1 . Ground-based Monitoring http://www.esrl.noaa.gov/gmd/grad/neubrew/ProductDisplays.jsp Satellite Monitoring http://www.star.nesdis.noaa.gov/smcd/spb/icvs/proSBUV2operational.php Opinions expressed are those of the authors and do not imply any official positions of NOAA or the JPSS Program. Work was support by NOAA, NASA, the JPSS Program, and the NCDC Science Data Stewardship Program.