Download
1 / 47
570 likes | 901 Vues
Site Investigation Report and Conceptual Site Model. Madison-Kipp Corporation April 10, 2013. Imagine the result. Presentation Outline. Present a summary of investigation activities and conclusions Present the Conceptual Site Model (CSM)

E N D
Site Investigation Report and Conceptual Site Model Madison-Kipp Corporation April 10, 2013 Imagine the result
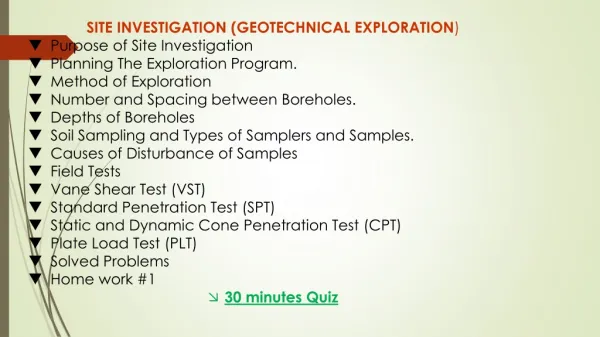
Presentation Outline • Present a summary of investigation activities and conclusions • Present the Conceptual Site Model (CSM) • Present in-situ chemical oxidation (ISCO) pilot test results • Solicit concurrence on next steps: • Soil • Soil Vapor • Groundwater
Summary of Investigation Activities (February 2012 through January 2013) • 8 SVE wells • 189 on-site soil borings • 78 off-site soil borings • 10 single-screen MWs • 4 multi-port MWs (20 intervals) • 10 pilot test wells • 4 vapor probes (bike path) • 22 sub-slab vapor probes (11 homes)
Site Investigation Conclusions • Soil • On-site and off-site investigation activities are complete • 189 on-site soil borings and 78 off-site hand auger boring locations. • 327 on-site and 183 off-site soil samples submitted for laboratory analyses including VOCs, PCBs, PAHs, and/or RCRA metals. 12 soil samples submitted for laboratory analysis of PCB homolog.
Site Investigation Conclusions • Soil (continued) • VOCs: • Concentrations above soil criteria generally observed on site near the former oil shed in the upper 2 feet of soil. • Concentrations were reported below soil criteria off site. • Concentrations decrease with depth and were delineated by on-site and off-site soil results. • VOCs Recommendations: • On-site engineered barrier, GIS Registry
Site Investigation Conclusions • Soil (continued) • PCBs: • Concentrations above soil criteria generally on site along the western property line, under the building and under the north parking lot in the upper 4 feet of soil, and below the building greater than 4 feet. • Concentrations decrease with depth and are delineated. • Concentrations above 50 mg/kg in the north parking lot were excavated in December 2012/January 2013. • PCBs Recommendations: • Removal of off-site soils above 0.22 mg/kg at four residences (241, 245, 253, and 257 Waubesa Street) and soils from 249 Waubesa at WDNR request • On-site engineered barrier, GIS Registry
Site Investigation Conclusions • Soil (continued) • PAHs • Concentrations above soil criteria were generally observed across the site. • Concentrations decrease with depth and are delineated. • Concentrations off-site were determined to be background and not attributed to MKC activities. • PAHs Recommendations: • On-site engineered barrier, GIS Registry • No further action off site by MKC (background)
Site Investigation Conclusions • Soil Vapor • VOCs (on site): • SVE system: Installed in February 2012 along the eastern property line of the north parking lot to mitigate the potential migration of soil vapors. • Soil vapor probes: Samples collected in October 2012 indicated decreased concentrations and only VP-102 contained a vapor VOC exceedance of the residential screening level. VP-102 is within the influence of the SVE system.
Site Investigation Conclusions • Soil Vapor (continued) • VOCs (off site): • Off-site Residential: • Sub-slab and indoor vapor samples collected by ARCADIS did not detect VOCs that exceeded the Wisconsin vapor action levels or calculated residential screening levels. • Two indoor air samples (113 South Marquette Street and 249 Waubesa Street) collected by the WDNR’s consultant indicated a concentration of TCE above the residential vapor action level. Split samples and subsequent samples did not confirm the TCE concentrations. • WDNR’s consultant installed SSDSs at these residences (113 South Marquette Street and 249 WaubesaStreet) in 2012. • VOCs Recommendations: • On-site SVE system and vapor probe monitoring program • No additional residential vapor sampling • Maintenance of 5 existing SSDSs installed by MKC
Site Investigation Conclusions • Groundwater • VOCs: • 55 groundwater sample locations exist: 35 monitoring wells and 4 multiport wells (20 sampling locations). • Samples were collected from all locations and submitted for laboratory analysis of VOCs, PCBs, PAHs and/or dissolved RCRA metals. • Groundwater VOC concentrations above the ES at most on-site well locations. • Primarily a south to southeast horizontal hydraulic gradient direction and a downward vertical hydraulic gradient at the Site.
Site Investigation Conclusions • Groundwater (continued) • VOCs: • PCE concentrations are delineated in the Unconsolidated Aquifer and Lower Lone Rock Formation. PCE is delineated in the Upper Wonewoc Formation to the east and west. The plume is delineated vertically on site by Monitoring Wells MW-3D3 and MW-5D3. • VOCs Recommendations: • Completion of site investigation via monitoring well installation southeast of site; ongoing ISCO pilot monitoring program to evaluate results and support full-scale design • No well is recommended to the north based on regional groundwater flow, potential unidentified upgradient sources.
Site Investigation Conclusions • Groundwater (continued) • PAHs: • Groundwater PAH ES exceedances were only reported at MW-3D3. • MW-3D3 was re-sampled in March 2013 and PAH concentrations were not detected verifying anomalous data point. • PAHs Recommendations: • No additional sampling.
Site Investigation Conclusions • Groundwater (continued) • PCBs: • PCB exceedances at Monitoring Wells MW-22S, MW-22D and MW-23D in the initial round of sampling (January 2013), within the building footprint. • Monitoring Wells MW-22S, MW-22D, and MW-23D were re-sampled in March 2013. MW-22S and MW-22D contained PCBs in the unfiltered groundwater samples. Filtered samples were non-detect for PCBs. MW-23D did not contain PCBs in filtered or unfiltered samples. • March 2013 results indicate that PCBs are not present in groundwater in the dissolved-phase and are instead adhered to sediment particles in the unfiltered samples. • PCBs Recommendations: • One additional round of confirmation samples for filtered and unfiltered PCBs from MW-22S and MW-22D during the April 2013 groundwater monitoring event.
Site Investigation Conclusions • Groundwater (continued) • RCRA Metals: • ES exceedances were only reported at Monitoring Well MW-3S with exceedances of chromium and mercury. • PAL exceedances of RCRA metals were limited to the north parking lot and under the building with exceedances of chromium, lead, mercury and arsenic. • The metal exceedances are limited to the on-site well locations. • MW-3S was re-sampled in March 2013. Concentrations decreased from January 2013. • RCRA Metals Recommendations: • No additional monitoring is recommended. However, RCRA metals will continue to be monitored as part of the ISCO post-injection monitoring program.
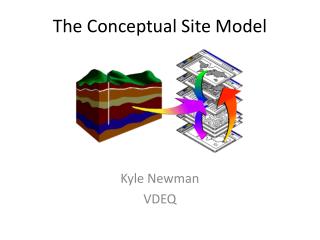
Conceptual Site Model (CSM) • Development of a successful remedial strategy is dependent on the assembly and testing of the Conceptual Site Model (CSM). • CSM synthesizes relevant data including: • Historical site use, • Geologic and hydrogeologic conditions, • Nature and extent of contamination, • Transport mechanisms, and • Potential receptors.
Regional Geology (USGS, 2001)
SITE LOCATION Regional Pumping Centers Half-Capacity Pumping Rates Unit Well 11 Unit Well 8 Unit Well 24 (Dane County, 2004)
Geophysical Data Collection • Gamma • Caliper • Temperature • Conductivity • Acoustical Televiewer • Optical Televiewer • Heat Pulse Flow Meter
Unconsolidated AquiferPotentiometric Map(0 – 30 feet bls) • Lake Mendota maintained at a higher elevation than Yahara River and Lake Monona. • Flow direction: • southeast • Horizontal gradient: 0.01 – 0.001 ft/ft
Lower Lone Rock FormationPotentiometric Map(60-95 feet bls) • Flow direction: predominantly south-southeast • Horizontal gradient: 0.01 – 0.001 ft/ft
Lower Wonewoc FormationPotentiometric Map(120-220 feet bls) • Flow direction: • southeast • Horizontal gradient: • 0.001 ft/ft
Downward Vertical Gradients • Exceptions include: MP-15, MW-9D, and MW-9D2 where upward gradients observed (~0.002 ft/ft)
Matrix Fractures Dual-Porosity Bedrock Transport Primary Porosity 17% – 29% • Chemical fate and transport in fractured bedrock groundwater occurs via combination of advection, diffusion and other mechanisms (hydrophobic sorption, chemical transformation) • Volume of groundwater in matrix porosity greatly exceeds that of the fracture porosity • Diffusion gradients between mobile fracture porosity and immobile matrix porosity contribute to chemical storage and retard transport Secondary Porosity 0.06% – 0.08%
ISCO PILOT INJECTION INTERVALS MW-3D3 Porewater VOCs 17 – 27 feet • Key Findings: • PCE rock concentrations ranged from non-detect to 190 mg/kg. • PCE concentrations in fracture and matrix samples are similar between ~60 to 90 feet. This implies that the PCE has likely penetrated the bedrock matrix. • PCE concentrations from fracture surfaces were higher than the matrix samples from ~110 to 140 feet indicating that PCE has not diffused into the bedrock matrix. • Negligible PCE porewater concentrations observed below 160 feet bls fracture zone. 60 – 90 feet 110 – 140 feet
MW-5D3 Porewater VOCs • Key Findings: • PCE rock concentrations ranged from non-detect to 260 µg/kg. • PCE concentrations from the fracture surfaces were higher than the bedrock matrix samples collected. This indicates that PCE has not diffused into the bedrock matrix to an appreciable extent. • Negligible PCE porewater concentrations observed below 155 feet bls fracture zone.
Site Attenuation Data (PCE) Data shown are representative of recent trends observed in selected wells
Unit Well 8 • Open bedrock well from 280 – 774 feet bls • Cased below Eau Claire Shale in the Mount Simon Formation • Pump Capacity: 1,800 gpm • Recent Annual Pumping Volumes: • 2011: ~56,000,000 gallons (106 gpm) • 2012: ~870,000 gallons (1.7 gpm) • Well Usage: • Seasonal well use (July through August). • Limited due to native iron and manganese levels above secondary standards. • Iron and manganese are commonly found in Madison area bedrock groundwater. • Causes yellow, brown, red, or black discolored water. • Iron/manganese filtration currently used or planned in other supply wells (Unit Wells 7, 10, and 29)
Additional Investigation Site • Well being installed: • ~875 feet southeast of Site and ~625 feet northwest of Unit Well 8. New Well MW-25 Unit Well 8 (Bing Maps, April 2013
Site Investigation Conclusions – Groundwater Unconsolidated Aquifer and Lower Lone Rock Formation • Primary groundwater flow is vertically downward, and horizontally south/southeast • PCE concentrations are delineated Upper Wonewoc Formation • Primary groundwater flow is south/southeast • Aquifer confined at the base by the Eau Claire Shale • PCE is vertically delineated on Site • PCE is delineated to the east and west • One additional well proposed southeast of site – consistent with dominant groundwater flow direction • No additional delineation wells proposed to north • Hydraulically upgradient of site relative to dominant flow direction • Suspected impacts from former dry cleaner • MTBE at MW-9D2 suggests presence of other unidentified source(s)
ISCO Pilot Testing and Full-Scale Remedial Design Considerations
Pilot Test Objectives • Determine hydraulic parameters required for full-scale remedy: • Interconnectivity of bedrock fractures • Oxidant and tracer distribution • Injection design parameters for full-scale application • Determine PCE treatment extent • While oxidant present • After oxidant consumption Use above to determine injection network and dosing for injection event(s)
ISCO Conclusions Hydraulic objectives: • Achieved distribution in all three vertical intervals – demonstrates fractures are interconnected • Determined necessary injection volumes and well spacing to support delivery Treatment objectives: • PCE destruction while oxidant present • Extended longevity of oxidant • Observed rebound where oxidant dosing was lower; provides evidence of matrix back diffusion
ISCO Recommendations • Additional monitoring activities (1 – 2 events) planned to continue evaluating PCE concentrations and oxidant longevity. • Additional data collection to provide further insight into dual-porosity storage model. • Data will guide decisions and refine anticipated end points for both active and passive remedies.
Next Steps - Soil • Removal of off-site soils with PCBs above 0.22 mg/kg at four residences (241, 245, 253, and 257 Waubesa Street) and 249 Waubesa Street • Homeowner meetings – targeted April 2013 • Excavation activities – Spring 2013 with WDNR and homeowner concurrence • On-site engineered barrier • Upgrade the current barrier – Summer/Fall 2013 • Cap Maintenance and Materials Handling Plan submittal – May 2013 • GIS Registry – upon site closure
Next Steps – Soil Vapor • On-site SVE system operation and maintenance – ongoing • Permanent SVE system installation – Spring 2013 • Vapor probe monitoring program • Bike Path - Quarterly 2013 • Site-wide – Semi-annual 2013 • Residential Home SSDS Maintenance (5 homes) – 2013 Annual Inspection
Next Steps - Groundwater • Completion of site investigation via monitoring well installation southeast of site – April/May 2013 • ISCO pilot monitoring program to evaluate results and support full-scale design (including MW-3S) – ongoing • Collection of one additional round of filtered and unfiltered samples from MW-22S and MW-22D – April 2013 • Collection of site-wide groundwater samples – Quarterly 2013 • Remedial design • WDNR meeting - May 2013
Closing Discussion • MKC seeks WDNR concurrence for next steps for soil, soil vapor, and groundwater • Timing of WDNR response • PAHs • PCBs • SI report