Download
1 / 33
330 likes | 505 Vues
Long-Term Clinical and Immunologic Outcomes Are Similar in HIV-Infected Persons Randomized to NNRTI versus PI versus NNRTI+PI-based Antiretroviral Regimens as Initial Therapy: Results of the CPCRA 058 FIRST Study.

E N D
Long-Term Clinical and Immunologic Outcomes Are Similar in HIV-Infected Persons Randomized to NNRTI versus PI versus NNRTI+PI-based Antiretroviral Regimens as Initial Therapy:Results of the CPCRA 058 FIRST Study MacArthur RD, Novak RM, Peng G, Chen L, Xiang Y, Huppler Hullsiek K, Kozal MJ, van den Berg-Wolf M, Henely C, Schmetter B, Dehlinger M for the CPCRA 058 Study Team and the Terry Beirn Community Programs for Clinical Research on AIDS
Introduction and Rationale • Long-term data from randomized trials on the consequences of initiating therapy with a protease inhibitor (PI), non-nucleoside reverse transcriptase inhibitor (NNRTI), or both (PI + NNRTI) are lacking. • FIRST, ACTG 3841, and INITIO2 all were initiated between 1998-1999 to compare these 3 strategies. • Unlike ACTG 384 and INITIO, FIRST was designed exclusively as a treatment strategy trial, without specifying which antiretroviral regimens were to be used within each strategy. 1Shafer RW et al; N Engl J Med 2003;349:2304-15 2INITIO Trial International Co-ordinating Committee; Lancet 2006;368:287-98
Target Population • ART naïve persons 13 years of age or older planning to start ART and willing to be randomized. • No prior PI or NNRTI treatment; no more than 4 cumulative weeks of prior NRTI treatment and no more than 1 week of prior 3TC treatment.
Design and Follow-up 1,397 Participants Randomized NNRTI Strategy: NNRTI + NRTIs (N=463) 3-class Strategy: PI + NNRTI + NRTI(s) (N=464) PI Strategy: PI + NRTIs (N=470) Median follow-up: 60 months (IQR 52-69 months) Lost to Follow-up: 9.67% (No study visit within 6 months of study closure for surviving participants)
Primary Objectives • To compare the NNRTI and PI strategies for the composite outcome of HIV disease progression to AIDS; death; or CD4+ cell count < 200 cells/mm3* • To compare the 3-class strategy with the pooled results of the two 2-class strategies for difference in CD4+ cell count beginning at 32 months *for those with CD4+ > 200 cells/mm3 at baseline
Statistical Methods • All analyses are intent-to-treat • Primary outcomes are adjusted for clinical unit and baseline CD4+ cell count • NNRTI versus PI comparison: Kaplan-Meier survival curves and proportional hazards regression models • 3-class versus pooled 2-class comparison: longitudinal regression models and analysis of variance
Baseline Characteristics BaselineCharacteristic Median (IQR) or Percent Age (years) 38.0 (32-44) Female (%) 20.6 Race/Ethnicity Black (%) 53.8 Latino (%) 17.0 White/Other (%) 29.2 CD4+ Count (cells/mm3) 162.5 (36-332) CD4+ < 200 (cells/mm3) (%) 56.0 Prior AIDS Event (%) 37.7 Viral Load (log10 copies/mL) 5.1 (4.5-5.6) Hepatitis B (%) 6.2 Hepatitis C (%) 19.6
PI and NNRTI Drugs Prescribed at Study Entry • PI Strategy: • Nelfinavir 61% • Ritonavir-boosted PI 26% • NNRTI Strategy: • Efavirenz 63% • Nevirapine 36% • 3-class Strategy: • Nelfinavir 63% • Efavirenz 52%
AIDS or Death or CD4+ Cell Count< 200 cells/mm3 * *Among patients with baseline CD4 ≥ 200 cells/mm3
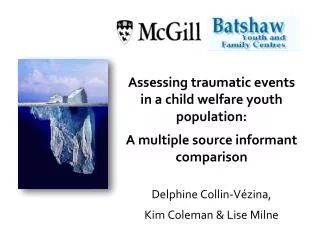
AIDS or Death or CD4+ Cell Count< 200 cells/mm3* Group No. With Event (Rate) Hazard Ratio(95%CI) PI NNRTI 1.02 All 126 (6.6) 122 (6.7) GenderMale 97 (6.5) 95 (6.6)Female 29 (7.2) 27 (7.0) RaceLatino 26 (8.5) 16 (5.6)Black 75 (7.5) 74 (7.6)White/Other 25 (4.2) 32 (5.6) 1.01 0.97 0.66 1.01 1.34 Favors NNRTI Favors PI *Among patients with baseline CD4 ≥ 200 cells/mm3
Favors PI Favors NNRTI AIDS or Death or CD4+ Cell Count< 200 cells/mm3* Group No. With Event (Rate) Hazard Ratio(95%CI) PI NNRTI All 126 (6.6) 122 (6.7) Prior AIDS 64 (9.2) 67 (10.6)No Prior AIDS CD4 ≤ 200 22 (4.8) 21 (4.5) CD4 > 200 40 (5.3) 34 (4.6) HIV RNA (copies/mL)<100,000 49 (5.9) 35 (4.3) 100,000 + 77 (7.2) 87 (8.6) 1.02 1.13 0.96 0.86 0.73 1.18 *Among patients with baseline CD4 ≥ 200 cells/mm3
Favors NNRTI Favors PI Favors 3-class Favors 2-class Outcomes Event Hazard Ratio (95% CI) NNRTI vs. PI 3-class vs. 2-class AIDS or death or CD4+ < 200 Death AIDS or death Grade 4 event AIDS or death orgrade 4 event Discontinuation of AR due to toxicity 1.15 1.02 0.95 1.28 1.07 1.15 1.02 1.01 1.04 1.06 0.93 1.58
Mean Change in CD4 Beginning at Month 32 Change in CD4 Difference* (95%CI) Group 3-class 2-class 6.7 All 227.0 233.5 Prior AIDS 252.0 289.1No Prior AIDS CD4 ≤ 200 247.1 256.2 CD4 > 200 190.2 177.7 HIV RNA (copies/mL) <100,000 182.8 188.2 100,000 + 259.3 270.6 28.8 1.8 -10.3 8.3 7.4 Favors 2-class Favors 3-class * Adjusted mean difference
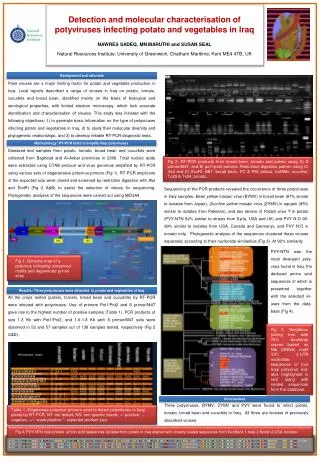
Percent With HIV RNA < 50 copies/mL OR* = 1.63 (95% CI 1.36 – 1.95) *Odds ratio (NNRTI versus PI) for achieving HIV RNA < 50 copies/mL
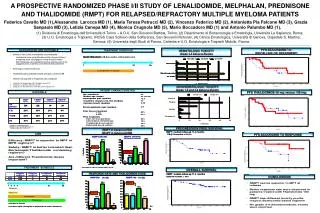
Time to Initial Virologic Failure* * HIV RNA > 1000 copies/mL at or after the 4-month visit
Genotypic Mutations1Detected At Initial Virologic Failure • IAS October 2004 list • 2 Percent is of those with a genotype
Distribution of Specific Mutations At Initial Virologic Failure 1 Percent is of those with a genotype
Summary: PI versus NNRTI Strategies • The PI and NNRTI strategies do not differ significantly for a composite outcome of CD4+ cell count decline, progression to AIDS, and death. Results are consistent across subgroups. • The NNRTI strategy resulted in better and more sustained virologic suppression compared to the PI strategy (as was found in ACTG 384 and INITIO). • At initial virologic failure the NNRTI strategy resulted in the selection of more class-specific mutations than did the PI strategy.
Summary: 3-class Strategy versus Pooled 2-class Strategies • A 3-class strategy is not superior to 2-class strategies for immunologic and clinical outcomes. • These findings were consistent for all subgroups, including those with CD4+ cell counts < 200 and 200+ and for those with VL < 100,000 and 100,000+ copies/mL. • More patients assigned the 3-class strategy had ART discontinued due to toxicity compared to the 2-class strategies.
Conclusions • The results of FIRST extend and corroborate the findings of ACTG 384 and INITIO. • The difference between the NNRTI strategy and the PI strategy for AIDS/death/CD4 < 200 and AIDS/death is not likely to be large: • AIDS/death/CD4 < 200 95% CI = 0.79 – 1.31 • AIDS/death 95% CI = 0.80 – 1.41 • This finding will be explored further in a planned meta-analysis of the 3 studies. • These results also are consistent with data from the EuroSIDA study1 which showed that for a fixed HIV RNA level/CD4+ cell count, the rate of AIDS or death does not differ based on ART regimen. 1Olsen CH, et al; AIDS 2005;19:319-30
Conclusions Initiation of therapy with either an NNRTI or a PI (ritonavir-boosted or unboosted), but not both together, are good and effective strategies for long-term antiretroviral management in treatment-naïve HIV-infected persons with a wide range of baseline CD4+ cell counts and diverse demographics
Acknowledgements • The 1397 participants • The CPCRA staff and physicians • James D. Neaton, Ph.D. • Other FIRST presentations at World AIDS • Body Composition Results (WEPE0143; CL Gibert) • Metabolic Substudy (THAB0101; J Shlay) • NNRTI Substudy (THPE0104; M van den Berg-Wolf)
Clinical Outcomes Number of Events and Rate per 100 Person Years NNRTI (N=463) PI (N=470) 3-class (N=464) No. Rate No. Rate Rate No. Outcome AIDS or Death or 126 6.6 122 6.7 140 7.8CD4+ <200 Death 60 2.8 56 2.6 72 3.4 AIDS or Death 95 4.8 98 5.1 109 5.7 Grade 4 Events 147 8.7 147 8.9 145 8.9 AIDS or Death or 187 11.5 191 12.4 192 12.5Grade 4 Event Discontinued AR due 171 11.2 158 10.3 226 17.6 to toxicity
Mean Change in CD4 Beginning at Month 32 Change in CD4 Difference (95% CI) Group 2-class 3-class 6.7 All 227.0 233.5 Gender Male 220.7 232.3Female 249.5 238.9 Race Latino 259.7 283.5Black 201.4 199.1White/Other 253.8 265.9 11.5 -7.8 21.0 -0.3 11.3 Favors 2-class Favors 3-class
Viral Load (VL) Outcomes Number of Events and Rate per 100 Person Years NNRTI (N=463) PI (N=470) 3-class (N=464) No. No. No. Rate Rate Rate Outcome VL > 50 copies/mL 403 52.8 342 31.9 385 45.0 or death VL > 1000 copies/mL 328 36.2 266 22.5 272 24.6 VL < 50 copies/mL 360 52.3 383 78.7 383 78.7
Hazard Ratios for Viral Load Outcomes -1 Hazard Ratios (95% Confidence Interval) PI NNRTI 3-class Outcome VL > 50 copies/mL 1.00 (ref) 0.63 (0.55-0.73) 0.86 (0.75-0.99) or death VL > 1000 copies/mL 1.00 (ref) 0.66 (0.56-0.77) 0.70 (0.60-0.83) VL < 50 copiesmL 1.00 (ref) 1.43 (1.24-1.65) 1.34 (1.16-1.55)
Hazard Ratios for Viral Load Outcomes - 2 Hazard Ratios (95% Confidence Intervals) NNRTI vs. PI Outcome 3-class vs. 2-class VL > 50 copies/mL 0.63 (0.55-0.73) 1.08 (0.96-1.23) or death VL > 1000 copies/mL 0.66 (0.56-0.78) 0.87 (0.75-1.00) VL < 50 copies/mL 1.42 (1.23-1.64) 1.13 (1.00-1.28)
Time to Viral Load < 400 copies/mL After Initial Virologic Failure Kozal MJ, et al; Abstracts of the XV International HIV Drug Resistance Workshop, June 13-17, 2006, Sitges, Spain