Download
1 / 40
400 likes | 422 Vues
Delve into the mysteries of the cosmos with Dr. Martin Hendry as you explore galaxies, cosmology, and Hubble's expanding universe in Astronomy II. Learn how to measure galaxy diameters and distances to uncover the secrets of our vast universe. Discover the impact of Hubble's Law and Einstein's General Relativity on our understanding of space and matter.

E N D
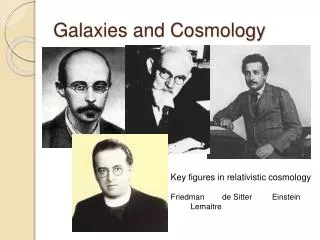
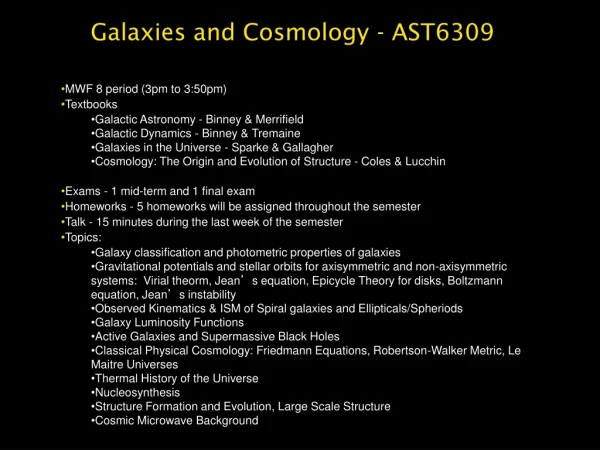
Dr Martin Hendry University of Glasgow, UK (Basler Chair, 2005) HENDRY@etsu.edu Tel: 94252 Brown Hall, Room 373 Office Hrs: Mon 10.30 – 11.30 Tue 14.30 – 15.30 Astronomy II, Fall 2005 Lectures on galaxies and cosmology http://www.astro.gla.ac.uk/users/martin/basler/astro2/
Measuring the intrinsic diameter of a galaxy 1 radian = 206265 arcsec 1 degree = 60 arcmin = 60 x 60 = 3600 arcsec Angular diameter (in RADIANS) Diameter Distance (See also Astronomy Today pg 28)
Hubble’s Expanding Universe Through the 1920s Hubble also measured the shift in colour, or wavelength, of the light from distant galaxies. Galaxy Laboratory He found that most galaxies displayed a redshift which, by applying the Doppler formula indicated that these galaxies were moving away from us.
Spectroscopic Binaries Orbits, from above B A A B B A B A To Earth Spectral lines B A A+B A B A+B
Doppler Shift Formula: (OK if v << c) Radial velocity (can be +ve or –ve) Change in wavelength (can be +ve or –ve) redshift Wavelength of light as measured in the laboratory Speed of light
Hubble’s Law: 1929 Distant galaxies are receding from us with a speed proportional to their distance
Hubble’s Interpretation ‘Recession of the Nebulae’ caused not by the motion of galaxies through space, but the expansion of space itself between the galaxies
Einstein’s General Relativity “Matter tells space how to curve, and space tells matter how to move”
Hubble’s constant Hubble’s Law v = H0 d Radial velocity distance H0has units of (time)-1 – usually measured in kilometres per second per Megaparsec It tells us how fast the Universe is expanding H0-1 = Hubble time = timescale for the expansion age of the Universe
So provided Hubble’s law holds for more distant galaxies, the measured recession velocity of a galaxy gives us an accurate estimate of its distance, assuming we know the value of the Hubble constant. Let’s look at Hubble’s original data again!
So Hubble’s original data led to a gross over-estimate of the Hubble constant, and hence a gross under –estimate of the age of the Universe. (The Universe can’t be younger than the Earth!) Main reason for Hubble’s error was that he got his distance estimates badly wrong (see later). But his linear relation between distance and recession velocity was correct, and holds well at much greater distances. Even if we don’t know the Hubble constant precisely, we can use the measured redshifts(radial velocities) of galaxies to estimate their relative distance. This lets us make 3-D maps of the Universe, which we call redshift surveys.
On this map, even without a scale, we still know: • the pattern of how buildings are laid out on campus • e.g. the CPA is twice as far from Brown Hall as the Culp Center.
Mapping the Universe with redshift surveys Largest feature presently seen is the so-called Great Wall in the Sloan Digital Sky Survey. This feature spans about 250 Mpc. On larger scales than this the Universe begins to look uniform (at least once we account for undersampling of dimmer galaxies very far away).
A hierarchy of clustering Galaxy clusters are collections of galaxies which are held together by their mutual gravity. The galaxies in a cluster are not receding from each other due to the expansion of the Universe; locally (i.e. within the cluster, the gravity is strong enough to overcome the expansion). On even larger scales we see patterns of galaxy clusters which we refer to as superclusters. These are not gravitationally bound.
A hierarchy of clustering The nearest rich cluster of galaxies to the Local Group is the Virgo Cluster, which contains about 2500 galaxies. It lies at a “distance” of about 1400 km/s (or ~20 Mpc). The Local Group and Virgo Cluster belong to the “Local Supercluster”: a concentration of many rich galaxy clusters within 5000 km/s
Measuring the Hubble Constant - 1 • We need to find (exactly as Edwin Hubble himself did!) some galaxies for which we can measure: • their redshift (recession velocity) • their distance (independently of their redshift) • If we plot recession velocity versus distance on a graph, and our data lies on (or close to) a straight line, then the slopeof the line is the Hubble constant. • (Astro II students will get the chance to do this for themselves in the Laboratory!)
Measuring the Hubble Constant – 2 So why did Hubble get it so wrong?... He was using the wrong calibration for his galaxy distances. (Like thinking measurements are in feet, when in fact they’re in inches!) The Virgo Cluster distorts Hubble’s Law in our Local Universe. Our Local Group has a “peculiar motion” towards the Virgo Cluster, due to the gravitational pull of its galaxies + dark matter. Hubble’s galaxies weren’t distant enough to overcome this problem. To measure the true value of the Hubble constant, we need to measure galaxy distances well beyond the Virgo Cluster
Problem: Need to determine H0 from remote galaxies, where peculiar motions are less important…. ….but…. We cannot use Cepheids to measure their distance Need Distance Ladder!!
A B Neutral hydrogen emission 1000 1500 The Tully Fisher Relation for Spirals The more luminous a spiral galaxy is, the faster it rotates. B A Direction towards the Earth
Problem: Need to determine H0 from remote galaxies, where peculiar motions are less important…. ….but…. We cannot use Cepheids to measure their distance Need Distance Ladder!!
Type I Supernova White dwarf star with a massive binary companion. Accretion pushes white dwarf over the Chandrasekhar limit, causing thermonuclear disruption Good standard candle because:- Narrow range of luminosities at maximum light Observable to very large distances
Some examples of Type I supernova light curves Narrow range of absolute magnitude at maximum light indicates a good Standard Candle B band absolute magnitude No. of days since maximum light
Luminosity and flux Apparent brightness, or flux, falls off with the square of the distance, because the surface area of a sphere increases with the square of its radius Distance, (metres) Luminosity, (watts) Flux, (watts / square metre)
Distance, (metres) Luminosity, (watts) Flux, (watts / square metre) A Type I supernova has a luminosity times that of the Sun. As seen from the Earth, the supernova appears fainter than the Sun. How far away is the supernova?
Measuring the Hubble Constant – 3 Although the errors which caused Hubble to find were gradually eliminated, even by the late 1980s, the value of the Hubble constant was still controversial, because of disagreements over the different steps of the Distance Ladder. Some astronomers argued that Others that The Hubble Space Telescope launched in 1990 was to come to the rescue! H0 ~ 500 kms-1 Mpc-1 H0 ~ 100 kms-1 Mpc-1 H0 ~ 50 kms-1 Mpc-1
HST has ‘bypassed’ one stage of the Distance Ladder, by observing Cepheids beyond the Local Group of galaxies
HST Key Project, led by Wendy Freedman Measure Cepheid distances to ~30 nearby galaxies, Link Cepheids to Secondary distance indicators
Virgo Cluster galaxy M100, 60 million light years distant…..
HST has ‘bypassed’ one stage of the Distance Ladder, by observing Cepheids beyond the Local Group of galaxies This has dramatically improved measurements of H0