Download
1 / 54
610 likes | 724 Vues
Learn about various analytical techniques to identify the structure and ensure purity of organic compounds, essential in medicine to avoid side effects. Understand key spectroscopic methods like IR, Mass Spec, and NMR for detailed analysis.

E N D
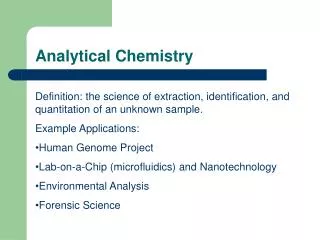
IB Chemistry Option 1Analytical Chemistry Determination of Structure
How Does One Determine the Structure of an Organic Compound? • Why do we need Analytical Techniques? • To identify the structure of a compound • To check the purity of compound • It will help to avoid undesirable side effects of medicines We must use several Analytical Techniques to determine structure of any Organic Compound.
Why more than one technique? Ans: - One technique is usually insufficient to provide all the necessary information. - It may provide limited information, but it may not be possible to accurately predict the structure of the compound.
Spectroscopic Methods • Which are the main spectroscopic methods addressed? (In the SL/HL chemistry exam) 1.Infrared Spectroscopy (IR) 2.Mass Spectrometry (Mass Spec) 3.Nuclear Magnetic Resonance Spectroscopy (NMR)
The Electromagnetic Spectrum Frequency (n) high low high low Energy MICRO- WAVE FREQUENCY X-RAY ULTRAVIOLET INFRARED RADIO Nuclear magnetic resonance Vibrational infrared Visible Ultraviolet 2.5 mm 15 mm 1 m 5 m 200 nm 400 nm 800 nm BLUE RED Wavelength (l) short long
IR Absorption • IR radiation is of too low an energy to excite electronic transitions • IR spectroscopy measures the absorption of light due to bond stretching or bending • Absorption is limited to vibrational and rotational levels • For liquids and solids, molecular rotation is often limited so the major type of interaction is vibrational • Different types of bonds absorb at different energies (frequencies)
Analyzing IR Spectra (1 of 3) • Look for C=O peak (1820-1660 cm-1) • If C=O check for OH (3400-2400 cm-1) • indicates carboxylic acid • If C=O check for NH (3500 cm-1) • indicates amide • If C=O check for C-O (1300-1000 cm-1) • indicates ester • If no OH, NH or C-O then ketone
Analyzing IR Spectra (2 of 3) • If no C=O check for OH (3600-3300 cm-1) • indicates alcohol • If no C=O check for NH (3500 cm-1) • indicates amine • If no C=O & no OH check C-O (1300 cm-1) • indicates ether • Look for C=C (1650-1450 cm-1) then aromatic
Analyzing IR Spectra (3 of 3) • Hydrogen stretching region (3700 to 2700 cm-1) • Triple bond region (2700 to 1850 cm-1) • Double bond region (1950 to 1550 cm-1) • Finger-print region (single bonds) (1500 to 700 cm-1)
Interpreting IR Spectra It is easiest to read an IR spectrum from left to right. Look for OH’s, Carbonyls, and alkene (aromatic ring) or alkanes.
O C CH3 Qualitative Analysis Acetophenone C B A A) C=O (1730) B) C=C aromatic (1590) C) C-H aromatic (3050)
Identify IR stretches corresponding to the functional Groups in given compound
Identify IR stretches corresponding to the functional Groups in given compound
Identify IR stretches corresponding to the functional Groups in given compound
Identify IR stretches corresponding to the functional Groups in given compound
A - CO-OH stretch (3000) B - CH stretch (2800) C - C=O ester (1757) D - C=O carboxy (1690) E - C=C aromatic (1608) F - C=C aromatic (1460)
MS Principles • Different elements can be uniquely identified by their mass
The Mass Spectrum • Plot the mass of ions (m/z) (x-axis) versus the intensity of the signal (roughly corresponding to the number of ions) (y-axis) • Tallest peak is base peak (100%) • Other peaks listed as the % of that peak • Peak that corresponds to the unfragmented radical cation is parent peak or molecular ion(M+)
The Mass Spectrum Masses are graphed or tabulated according to their relative abundance.
Fragmentation of CH3OH CH3OH CH3OH+ CH3OH CH2O=H+ + H CH3OH + CH3 + OH CH2O=H+ CHO=H+ + H
Electron Impact MS of CH3OH Molecular ion EI Breaks up Molecules in Predictable Ways
FRAGMENTATION PATTERNS ALKANES & ALKENES The mass spectra of simple hydrocarbons have peaks at m/z values corresponding to the ions produced by breaking C-C bonds. Peaks can occur at ... m/z 15 29 43 57 71 85 etc. CH3+ C2H5+ C3H7+ C4H9+ C5H11+ C6H13+ • the stability of the carbocation formed affects its abundance • the more stable the cation the higher the peak • the more alkyl groups attached to the carbocation the more stable it is most stable tertiary 3° > secondary 2° > primary 1° least stable alkyl groups are electron releasing and stabilise the cation
Mass Spectra of Alkanes More stable carbocations will be more abundant.
Mass Spectra of Alkenes Resonance-stabilized cations favored.
20 40 60 80 100 Abundance % m/z 0 10 20 30 40 50 60 70 80 90 100 110 120 130 140 FRAGMENTATION PATTERNS HALOGENOALKANES Multiple peaks occur in the molecular ion region due to different halogen isotopes. There are two peaks for the molecular ion of C2H5Br, one for the molecule containing the isotope 79Br and the other for the one with the 81Br isotope. Because the two isotopes are of similar abundance, the peaks are of similar height. molecular ion contains...79Br 81Br
FRAGMENTATION PATTERNS ALDEHYDES AND KETONES Cleavage of bonds next to the carbonyl group (C=O) is a characteristic fragmentation of aldehydes and ketones. A common fragment is carbon monoxide (CO) but as it is a molecule and thus uncharged it will not produce a peak of its own. However, it will produce an m/z drop of 28 somewhere in the spectrum. The position of the carbonyl group influences the fragmentation pattern because the molecular ion fragments either side of the carbonyl group the more stable the acylium ion RCO+, the more abundant it will be and the more abundant the species the taller its peak in the mass spectrum
O CH3 C C4H9 FRAGMENTATION PATTERNS Aldehydes and ketones The position of the carbonyl group influences the fragmentation pattern because the molecular ion fragments either side of the carbonyl group. MOLECULAR ION has m/z = 100 • +
O CH3 C C4H9 O C4H9 C+ O C4H9 C• FRAGMENTATION PATTERNS Aldehydes and ketones The position of the carbonyl group influences the fragmentation pattern because the molecular ion fragments either side of the carbonyl group. MOLECULAR ION has m/z = 100 • + Breaking the bond between the methyl group and the carbonyl group produces two possible ions, depending on how the bond breaks. Two peaks at m/z values 15 and 85 will appear in the mass spectrum. CH3• m/z = 85 CH3+ m/z = 15
O CH3 C C4H9 O CH3 C+ O CH3 C• FRAGMENTATION PATTERNS Aldehydes and ketones The position of the carbonyl group influences the fragmentation pattern because the molecular ion fragments either side of the carbonyl group. MOLECULAR ION has m/z = 100 • + Breaking the bond between the butyl group and the carbonyl group produces two further ions, depending on how the bond breaks. Two peaks at m/z values 43 and 57 will appear in the mass spectrum. C4H9• m/z = 43 C4H9+ m/z = 57
O CH3 C C4H9 O C4H9 C+ O CH3 C+ O C4H9 C• O CH3 C• FRAGMENTATION PATTERNS Aldehydes and ketones The position of the carbonyl group influences the fragmentation pattern because the molecular ion fragments either side of the carbonyl group. Example; MOLECULAR ION has m/z = 100 • + CH3• C4H9• m/z = 85 m/z = 43 CH3+ C4H9+ m/z = 15 m/z = 57 A further peak occurs at m/z = 72 (100-28) due to loss of CO
Mass Spectra of Alcohols • Alcohols usually lose a water molecule. • M+ may not be visible.
Principles of NMR • Measures nuclear magnetism or changes in nuclear magnetism in a molecule • NMR spectroscopy measures the absorption of radio waves due to changes in nuclear spin orientation • NMR only occurs when a sample is in a strong magnetic field • Different nuclei absorb at different energies (frequencies)
Chemical Shifts • Key to the utility of NMR in chemistry • Different 1H in different molecules exhibit different absorption frequencies • Arise from the electron cloud effects of nearby atoms or bonds, which act as little magnets to shift absorption n up or down • Mostly affected by electronegativity of neighbouring atoms or groups
Spin-Spin Coupling • Many 1H NMR spectra exhibit peak splitting (doublets, triplets, quartets) • This splitting arises from adjacent hydrogens (protons) which cause the absorption frequencies of the observed 1H to jump to different levels • NOT NEEDED FOR SL CHEM EXAM!
Absorbance Typical 1H NMR Spectrum
NMR Spectrum of Phenylacetone NOTICE THAT EACH DIFFERENT TYPE OF PROTON COMES AT A DIFFERENT PLACE ……… YOU CAN TELL HOW MANY DIFFERENT TYPES OF HYDROGEN THERE ARE!
Benzyl Acetate The integral line rises an amount proportional to the number of H in each peak integral line simplest ratio of the heights 55 : 22 : 33 = 5 : 2 : 3
PEAKS ARE MEASURED RELATIVE TO TMS Rather than measure the exact resonance position of a peak, we measure how far downfield it is shifted from TMS. reference compound tetramethylsilane “TMS” Highly shielded protons appear way upfield. TMS Chemists originally thought no other compound would come at a higher field than TMS. shift in Hz downfield n 0
THE CHEMICAL SHIFT The shifts from TMS in Hz are bigger in higher field instruments (300 MHz, 500 MHz) than they are in the lower field instruments (60 MHz, 100 MHz). We can adjust the shift to a field-independent value, the “chemical shift” in the following way: parts per million shift in Hz chemical shift = d = = ppm spectrometer frequency in MHz This division gives a number independent of the instrument used. A particular proton in a given molecule will always come at the same chemical shift (constant value).
NMR Correlation Chart -OH -NH DOWNFIELD UPFIELD DESHIELDED SHIELDED CHCl3 , TMS d (ppm) 12 11 10 9 8 7 6 5 4 3 2 1 0 H CH2Ar CH2NR2 CH2S C C-H C=C-CH2 CH2-C- CH2F CH2Cl CH2Br CH2I CH2O CH2NO2 C-CH-C RCOOH RCHO C=C C C-CH2-C C-CH3 O Ranges can be defined for different general types of protons. This chart is general, the next slide is more definite.
O O O O O O O APPROXIMATE CHEMICAL SHIFT RANGES (ppm) FOR SELECTED TYPES OF PROTONS R-CH3 0.7 - 1.3 R-N-C-H 2.2 - 2.9 R-C=C-H R-CH2-R 1.2 - 1.4 4.5 - 6.5 R-S-C-H 2.0 - 3.0 R3CH 1.4 - 1.7 I-C-H 2.0 - 4.0 H R-C=C-C-H 1.6 - 2.6 Br-C-H 2.7 - 4.1 6.5 - 8.0 Cl-C-H 3.1 - 4.1 R-C-C-H 2.1 - 2.4 R-C-N-H RO-C-H 3.2 - 3.8 5.0 - 9.0 RO-C-C-H 2.1 - 2.5 HO-C-H 3.2 - 3.8 R-C-H HO-C-C-H 2.1 - 2.5 9.0 - 10.0 R-C-O-C-H 3.5 - 4.8 N C-C-H 2.1 - 3.0 O2N-C-H 4.1 - 4.3 R-C-O-H R-C C-C-H 2.1 - 3.0 11.0 - 12.0 F-C-H 4.2 - 4.8 C-H 2.3 - 2.7 R-N-H 0.5 - 4.0 Ar-N-H 3.0 - 5.0 R-S-H R-O-H 0.5 - 5.0 Ar-O-H 4.0 - 7.0 1.0 - 4.0 R-C C-H 1.7 - 2.7
YOU DO NOT NEED TO MEMORIZE THE PREVIOUS CHART! IT IS USUALLY SUFFICIENT TO KNOW WHAT TYPES OF HYDROGENS COME IN SELECTED AREAS OF THE NMR CHART ALSO – You have IBO Reference Table 19! C-H where C is attached to an electronega-tive atom CH on C next to pi bonds aliphatic C-H acid COOH aldehyde CHO benzene CH alkene =C-H X=C-C-H X-C-H 12 10 9 7 6 4 3 2 0 MOST SPECTRA CAN BE INTERPRETED WITH A KNOWLEDGE OF WHAT IS SHOWN HERE
NMR vs. IR • NMR has narrower peaks relative to IR • NMR yields far more information than IR • NMR allows you to collect data on solids & liquids but NOT gases • NMR is more quantitative than IR or UV • NMR samples are easier to prepare • NMR is much less sensitive than IR or UV • NMR spectrometers are very expensive