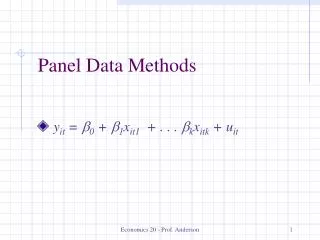
Model Panel Data
Model Panel Data. Tipe-tipe data yang umumnya digunakan dalam studi-studi empirik : Data time series. Dalam data time series kita mengobservasi nilai dari satu atau beberapa variable sepanjang periode waktu tertentu

Model Panel Data
E N D
Presentation Transcript
Tipe-tipe data yang umumnyadigunakandalam studi-studiempirik: • Data time series.Dalam data time series kitamengobservasinilaidarisatuataubeberapa variable sepanjangperiodewaktutertentu • Data cross section. Dalam data cross section nilaidarisatuataubeberapa variable dikumpulkanuntukbeberapa unit sample atauentitaspadasuatutitikwaktu yang sama.
Data Panel • Data yang terdiriatas a group of cross-sectional units (people, households, firms, states, countries) who are observed over time • Dalam data panel, unit cross sectional yang sama (mis.: perusahaan, orang, rumahtangga, negara) disurveisepanjangwaktutertentu. • Pendeknya, data panel mempunyaidimensiwaktudanruang. • Denote the number of cross-sectional units (individuals) by N • Denote the number of time periods in which we observe them as T
Jikasetiap unit cross sectional memilikijumlahobservasi time series yang sama, maka panel data sepertiitudisebutsebagaibalanced panel.Jikatidak, makadisebutunbalanced panel. • Contohsuatustudi yang dilakukanuntukmenganalisisfaktor-faktor yang berpengaruhterhadaptingkatupah(wage). Dihipotesiskanbahwawage=f(x1, x2, x3, …, x6). Sampel yang digunakandalampenelitianiniadalahperempuanpekerjasebanyak N=716 yang diinterviewpadatahun 1982, 1983, 1984, 1985, dan 1986. • Data panel dalampenelitianinimerupakancontohbalanced panel.
15.1 A Microeconomic Panel Table 15.1 Representative Observations from NLS Panel Data
Bagaimanamengestimasipersamaanregresiuntukwage function (wage=f(x1, x2, x3, x4, x5, x6) denganmenggunakan data panel ini? • Adabeberapapendekatan, 3 diantaranya: - Pooled Model - Fixed Effect Model - Random Effect Model
15.2 Pooled Model • Pooled model merupakan model dimana data dariberbagaiindividudalam unit cross section digabungkanbersama-samajadisatudengantidakmempertimbangkankemungkinanperbedaankarakteristikantarindividu yang akanmengarahkanpadaperbedaankoefisien. • Dalamkondisidemikianpooled model dituliskansbb.: • Perhatikanbahwakoefisien (β1, β2, β3) tidakmemiliki subscripts iataut. • Inimenunjukkanbahwapengaruhx2danx3terhadapy (wage) adalahsamauntuksemuaindividudalam unit cross section. Eq. 15.1
15.2 Pooled Model • The least squares estimator, when applied to a pooled model, is referred to as pooled least squares • The data for different individuals are pooled together, and the equation is estimated using least squares
15.2 Pooled Model 15.2.1 Cluster-Robust Standard Errors • Menerapkan pooled least squares denganmengabaikansifat panel data, dalambeberapahalmengandungkelemahan. • dalamhalasumsi yang dianggaptidakrealistikyaituketiadaankorelasiantar error untukpengamatanpadaindividu yang sama.
15.3 The Fixed Effects Model Fixed Effect Model • Kita dapatmemperluas model dalam in Eq. 15.1 denganmelonggarkanasumsibahwasemuaindividumemilikikoefisien yang sama. • Modifikasimodelnyamenjadi: • subscript iyang ditambahkanpadasetiapkoefisienmenunjukkanbahwakoefisien (β1, β2, β3) dapatberbedaantarindividu. Eq. 15.2
15.3 The Fixed Effects Model • Untukmenghindariterlalubanyaknya parameter yang harusditaksir, kitadapatmembuatsimplifikasiataspersamaan 15.2 • Simplifikasi yang umumdilakukanadalahdenganmembangun model dimanaintersepβ1iberbedaantarindividutetapi slope koefisienβ2 and β3diasumsikankonstanuntuksemuaindividu. • Persamaan 15.2, kemudianmenjadi: Eq. 15.3
15.3 The Fixed Effects Model • Persamaantersebutmenunjukkanbahwasemuaperbedaanperilakuantarindividu, yang disebutsebagaiindividual heterogeneity, diasumsikanditangkapolehunsurintersep. • A model with these features is called a fixed effects model • The intercepts are called fixed effects
15.3 The Fixed Effects Model • Bagaimanamengestimasipersamaan 15.3? • The least squares dummy variable (LSDV) estimator • The fixed effects estimator
15.3 The Fixed Effects Model • One way to estimate the model in Eq. 15.3 is to include an intercept dummy variable (indicator variable) for each individual • If we have 10 individuals, we define 10 such dummies • Now we can write: 15.3.1 The Least Square Dummy Variable Estimator for Small N Eq. 15.4
15.3 The Fixed Effects Model • In a panel data context, it is called the least squares dummy variable (LSDV) estimator 15.3.1 The Least Square Dummy Variable Estimator for Small N
15.3 The Fixed Effects Model Table 15.3 Dummy Variable Estimation of Wage Equation for N = 10 15.3.1 The Least Square Dummy Variable Estimator for Small N
15.3 The Fixed Effects Model Table 15.4 Pooled Least Squares Estimates of Wage Equation for N = 10 15.3.1 The Least Square Dummy Variable Estimator for Small N
15.3 The Fixed Effects Model • We can test the estimates of the intercepts: • Hipotesisdiatasdigunakanuntukmengujiapakahpendekatanpooled least squares tepatdigunakan? • Dituliskandengancara lain: H0: Pooled Least Squares H1: Fixed Effect Model 15.3.1 The Least Square Dummy Variable Estimator for Small N
15.3 The Fixed Effects Model • Hipotesisdapatdiujimenggunakanproseduruji-F (Wald Test). Membandingkan F stat dengan F tabel. • The F-statistic is: 15.3.1 The Least Square Dummy Variable Estimator for Small N
15.3 The Fixed Effects Model • Jika F stat lebihbesardari F tabel • We reject the null hypothesis that the intercept parameters for all individuals are equal. • We conclude that there are differences in individual intercepts, and that the data should not be pooled into a single model with a common intercept parameter 15.3.1 The Least Square Dummy Variable Estimator for Small N
15.3 The Fixed Effects Model • Using the dummy variable approach is not feasible when N is large • Another approach is necessary yaitufixed effect estimator. 15.3.2 The Fixed Effects Estimator
15.4 The Random Effects Model Random Effect Model (REM) • Sepertipada FEM, dalam random effects model, kitamengasumsikanbahwasemuaperbedaanindividuditangkapolehintersep. • Namundemikianjikapada FEM setiap unit cross sectionmemilikinilaiinterseptersendiri yang fixed, makadalam REM nilaiintersepuntuksetiapindividubersifat random. Dalamarti, semuaindividudalam unit cross section memiliki rata-rata intersep yang samadanperbedaanindividudalamnilaiintersepdirefleksikandalanerror term ui . • Nilaiintersepuntuksetiapindividuadalahnilaiintersep rata-rata dariseluruhintersepcross sectionalditambahkomponenerror yang merepresentasikandeviasirandom intersepindividudarinilaiintersep rata-rata.
15.4 The Random Effects Model • Dengandemikiannilaiintersepuntukindividudapatdinyatakandengan: • Persamaandiatasmenunjukkanbahwaintersepindividuterdiriatasintersep rata-rata seluruh unit cross section ditambahperbedaan individual yang bersifat random. • The random individual differences uiare called random effects.
15.4 The Random Effects Model • Substituting, we get: • Rearranging: Eq. 15.18 Eq. 15.19
Gabungan error term vtpadapersamaan 15.19 terdiridariduakomponen, uiyang merupakankomponenerror cross sectiondaneit yang merupakankombinasierror term time series dancross section. • Olehkarenaitu, random effect model seringjugadisebutsebagaierror componentmodel, merupakangabungan yang terdiriatasduaataulebihkomponenerror. • Estimasiatas parameter dalampersamaan 15.19 dilakukandenganmenerapkangeneralized least squares.
15.5 Comparing Fixed and Random Effects Estimators
15.5 Comparing Fixed and Random Effects Estimators • Kita mempunyaiduaalternatifdariestimasi pooled least squares yaitu FEM dan REM. Kelebihan REM dibanding FEM adalah: • Random effects estimator memungkinkankitauntukmengestimasiefekvariabel yang bersifat individually time-invariant (lihatcontoh variable BLACK danEDUC yang harushilangdariestimasi FEM) • Estimasi parameter dalam REM menggunakanprosedurestimasi GLS, sementara FEM menggunakanprosedur least squares. Dalamsampelbesar estimator GLS memilikivarians yang lebihkecildibanding estimator least squares.
Namundemikian, terdapatpotensimasalah yang mungkinmunculjikakitamenggunakan REM, yaitukemungkinankorelasiantara error dengan explanatory variable (x) → disebutmasalahendogenitas. • Olehkarenaitukitadapatmelakukanpengujianuntukmenentukanapakah REM atau FEM yang lebihtepat? • Pengujiandilakukanatashipotesisberikut: H0 : Random Effect Model (Tidakadakorelasiantara error denganx → cov(vit, xit) = 0) • H1 : Fixed Effect Model
PengujiandilakukandenganprosedurujiHausman, membandingkanχ2hitungdenganχtabel. χtabel = χ((1-α), df), dengandf = jumlahkoefisienvariabelbersama yang diestimasi. • Tolak H0 jikaχ2hitung > χtabel.