Download
1 / 13
160 likes | 632 Vues
Pan Evaporation Rates of Southeastern Arizona. Alison Radei Mentors: Dr. Mary Nichols and Michelle Cavanaugh USDA-ARS-Southwest Watershed Research Center April 12, 2014. Background. Evaporation is a critical component of the hydrologic cycle Evaporation data are needed for:

E N D
Pan Evaporation Rates of Southeastern Arizona Alison Radei Mentors: Dr. Mary Nichols and Michelle Cavanaugh USDA-ARS-Southwest Watershed Research Center April 12, 2014
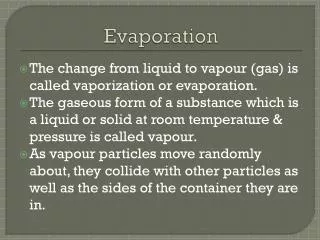
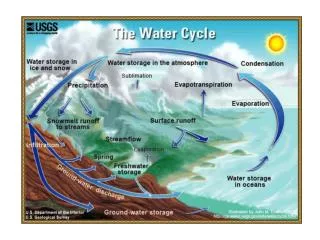
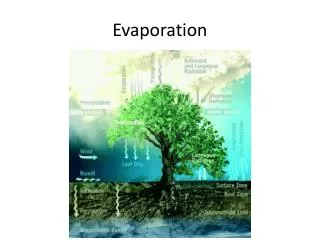
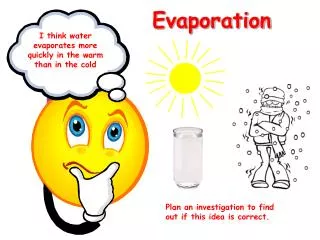
Background • Evaporation is a critical component of the hydrologic cycle • Evaporation data are needed for: • estimating transpiration from plants • computing losses from ponds and lakes credit: http://www.state.nj.us/drbc/hydrological/
Background • Although global temperatures have been increasing, decreasing rates of pan evaporation have been reported in the literature. • Decreasing pan evaporation rates have been attributed to changes in wind patterns
Objectives • Quantify pan evaporation rates from data collected in Tombstone, Arizona. • Determine if there are trends over time in monthly evaporation rates.
Study Area USDA-ARS Walnut Gulch Experimental Watershed Tombstone Arizona • Semiarid • Rangeland
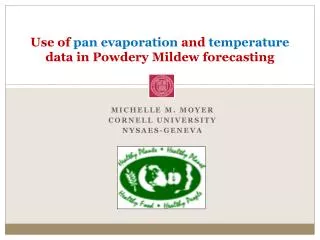
Methods • A hook gage is used to measure water depth • Measurements are recorded daily at 8 a.m. • Data collected from 1974 to 2012 were used in this study Class A evaporation pan
Methods • Additional measurements: • daily maximum & minimum temperature • 8 a.m. temperature • wind speed • precipitation Raingage Anemometer
Data • 39 years of data were entered into a spreadsheet • Data were evaluated to identify outliers and gaps in the record • Poor quality measurements were identified • e.g. ice in the pan • Daily data were combined to estimate monthly pan evaporation values
Preliminary Results • Mean monthly evaporation ranged from a minimum of 4 inches per month in January to a maximum of 13 inches per month in June. • We then plotted annual evaporation for individual months.
Preliminary Results • Annual evaporation rates for each month were plotted over the 39 year period of record • Preliminary analysis to look for trends in time
Preliminary Results • Annual pan evaporation rates are variable, but do not show strong trends with time
Conclusions • Long-term mean monthly pan evaporation rates at Tombstone, Arizona range from 4 inches per month to 13 inches per month.These values are consistent with other pan evaporation rates in Southeastern Arizona. • Preliminary results do not suggest strong trends in pan evaporation over the 39 year period of record. • Research to interpret these data is ongoing. • Future research will relate pan evaporation rates towind speed, humidity, and temperature.