Download
1 / 21
210 likes | 323 Vues
Poverty and Social Exclusion in Northern Ireland: preliminary findings Irish Social Policy Association Conference September 2003 Paddy Hillyard, University of Ulster Eithne McLaughlin, Queen’s University Mike Tomlinson, Queen’s University. Key objectives:

E N D
Poverty and Social Exclusion in Northern Ireland: preliminary findings Irish Social Policy Association Conference September 2003 Paddy Hillyard, University of Ulster Eithne McLaughlin, Queen’s University Mike Tomlinson, Queen’s University
Key objectives: a) to provide a baseline measurement of PSE in N. Ireland b) to provide data on the extent to which PSE impact across the nine dimensions of equality specified in Section 75 of the Northern Ireland Act 1998; and c) to provide data which allow Northern Ireland to be compared with the results of the British PSE Survey, HBAI and poverty levels in the Republic of Ireland. Website: http://www.qub.ac.uk/ssp/pseni.htm
Two stages: 1. Necessities survey asked what people believe to be the basic necessities of life. Presents randomised list of: Adults: items activities Children: items activities
2. Main survey: • Household Section • Household questions • Individual Section • Demography • Necessities and Economising • Opinions on standard of living • Intra-household Living Standards • Views on poverty Level • Health and Disability • [Optional modules A OR B] See below • Economic Activity • Income • Assets and Debt • Self Completion section (Section 75)
Main survey: Module A Module B Area Characteristics Activism Community Support Local Services Mobility The ‘troubles’ Key question for PSE poverty measure: Do respondents have necessities? If not, is this because they can’t afford them?
Poverty measures Relative income ‘Overall poverty’ (Living in Ireland) HBAI (Britain) Deprivation and relative income ‘Consistent poverty’ (Living in Ireland) PSEB Equivalence scales matter
Equivalence scales PSE1 McClements2 Modified RoI (A) OECD First Adult 0.70 0.61 1.0 1.00 Spouse 0.30 0.39 0.5 0.66 Other Second Adult 0.45 0.46 0.5 0.66 Third Adult 0.45 0.42 0.5 0.66 Subsequent Adults 0.45 0.36 0.5 0.66 Children aged < 14yrs 0.35 0.20 0.3 0.33 Children aged 14yrs + 0.30 0.30 0.5 0.33 Mean (£370.1) 304.8 343.9 221.3 205.7 Median (£290.0) 236.4 270.0 170.0 162.2 Notes 1. The PSE scale weights the first child at 0.35 and each additional child at 0.3. If the head of the household is a lone parent 0.1 is added. 2. The McClements scale has more age groups than shown above: 0-1 = 0.09; 2-4 = 0.18; 5-7 = 0.21; 8-10 = 0.23; 11-12 = 0.25; 13-15 = 0.27; 16 and over = 0.36.
Proportion of households ( and persons) below various relative income thresholds PercentagesEquivalence scale Households N = 1976 PSE Modified McClements Republic (Persons N = 5163) OECD of Ireland <70% Median 32.1 (32.3) 30.1 (28.8) 30.9 (29.5) 31.0 (30.6) <60% Median 24.1 (24.7) 22.9 (21.8) 23.5 (21.6) 23.7 (23.2) <50% Median 16.4 (17.3) 14.1 (13.8) 14.6 (14.1) 14.6 (14.1) <60% Mean 35.6 (36.9) 35.9 (34.7) 34.4 (33.5) 34.6 (35.1) <50% Mean 26.9 (27.8) 27.1 (25.3) 25.7 (23.2) 26.7 (26.7) <40% Mean 17.5 (18.1) 16.3 (15.7) 14.9 (14.3) 15.4 (15.3)
Combining low income and deprivation Living in Ireland – ‘consistent poverty’ 1 of 8 pre-determined items plus low income (60 per cent of median) PSE – ‘consensual poverty’ 3 of 29 items defined by popular consensus plus low income
Results, PSE NI: 29.6 per cent of households are poor 37.4 per cent of all children (<16) live in poor households
Proportion of persons in ‘consistent’ poverty (Ireland, North and South)
Proportion of persons in ‘overall’ poverty – median income thresholds (Ireland, North and South)
RoI: Overall <60% Mean* GB: HBAI <60% Mean RoI: Overall <70% Median PSE GB: HBAI <70% Median RoI: Overall <50% Mean* GB: HBAI <50% Mean RoI: Overall <60% Median GB: HBAI <60% Median RoI: Consistent <60% Mean* RoI: Consistent <50% Mean* 0 5 10 15 20 25 30 35 40 N. Ireland poverty rates, using different methods of calculation – proportions of persons (*households)
Income distribution (McClements equivalised) of total Northern Ireland population 2002/2003
Gini coefficients 1998/99 FES 38 1999/00 FES 36 2000/01 FES 39 2002/03 PSENI 42
Section 75 equality dimensions: Poverty varies significantly (***) by Gender Religion Political opinion National identity Age Marital status Disability Dependants (**) ‘Race’ and sexuality, v. small numbers
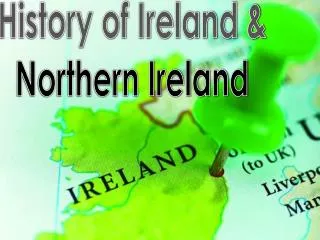
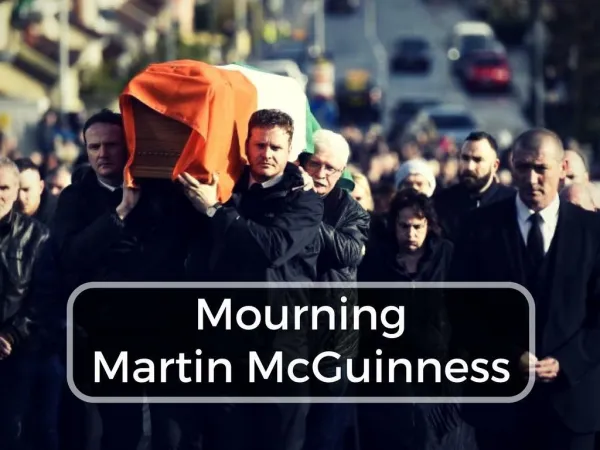
Experience of the conflict: knowing someone killed