Download
1 / 25
250 likes | 367 Vues
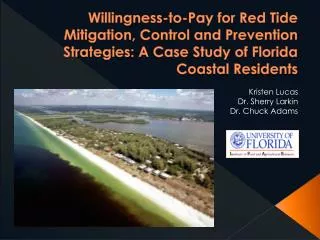
Willingness-to-Pay for Red Tide Mitigation, Control and Prevention Strategies: A Case Study of Florida Coastal Residents. Kristen Lucas Dr. Sherry Larkin Dr. Chuck Adams. Survey Information. North Central : 1,674 (St. Johns, Flagler, Volusia, and Brevard). 14,400 mail surveys

E N D
Willingness-to-Pay for Red Tide Mitigation, Control and Prevention Strategies: A Case Study of Florida Coastal Residents Kristen Lucas Dr. Sherry Larkin Dr. Chuck Adams
Survey Information North Central: 1,674 (St. Johns, Flagler, Volusia, and Brevard) • 14,400 mail surveys • 1,454 responses • Funded by Florida Wildlife Commission • Topics: • Level of knowledge • Level of concern • Information sources • Willingness-to-pay Northwest: 6,102 (Gulf, Franklin, Bay, and Okaloosa) Southwest : 6,624 (Manatee, Sarasota, Charlotte, and Lee)
Demographics Age distribution (years): N=1,426 Average age of respondents:59.9 years Average length of Florida residency: 24.2 years
Education: N=1,431 Annual Income: N=1,322
How many miles (by car) do you live to the coast? N=1,426 (Average miles of residence to coast = 8.7 miles)
How dependent are you on coastal water quality and quantity? N=1,338
Awareness, Experience, Knowledge and Concern Are you aware of the coastal condition known as Red Tide? Are you at all concerned about Florida Red Tide Events? N=1,431 N=1,305
What is the one reason you are at least somewhat concerned about red tide events in Florida? What is the one reason you are generally notconcerned about red tide events in Florida? N=287 N=858
What has been your experience with red tide in Florida? Yes No N
Do you believe each statement is True (T) or False (F) with respect to red tides in Florida? If you are unsure, please circle don’t know (DK): T F DK N
CON’T N T F DK
Information Which of the following statements best describes how frequently you seek information about Florida red tides?
Willingness-to pay • Respondents presented with 3 WTP scenarios • Prevention • Control • Mitigation • 3 price levels: High, Medium and Low • Surveys randomized: 18 versions • Follow-up questions for each scenario • “Yes” responses asked about the certainty of their response • “No” responses asked if there is any amount they would be WTP • Respondents asked to evaluate each independently
Mitigation: Would you pay a one-time donation of $X into a trust fund for access to information provided by a Beach Reporting System for the next three years? Average days spent at beach, per year: 49 days
Control: Would you vote for a 3-year ad-valorem fee of $X per $100,000 of the assessed value of all taxable property in your county to fund a local Red Tide Control program? Did you pay property taxes in the state of Florida in 2009? Yes: 87% No: 13% In general, which type of control most appeals to you? Biological: 56% Chemical: 21% Neither: 23%
Prevention: Would you vote for a X% tax on all fertilizer sales to support a long-run prevention program? Would this program cost you more because you use plant fertilizers in Florida? 55% Yes 45% No
Of the three types of red tide programs you just evaluated, which would you prefer if the State of Florida only had funds for one?
Methodology • Preliminary modeling in LIMDEP using logit distribution • dichotomous choice (DC) model to estimate “yes” or “no” binary response for each WTP scenario • separate model for each scenario • independent variables include demographics, location, concern with red tide, dependence on local water quality, and the order in which the scenario appears. • distinct variable that is based on whether respondent is affected by strategy for each model
Binomial Logit: Mitigation *Variables significant at 5% level Notes: N=832; 2=130.93; LnL=-485.70; 69% correct predictions
Binomial Logit: Control *Variables significant at 5% level Notes: N=997; 2=296.97; LnL=-542.49; 71% correct predictions
Binomial Logit: Prevention *Variables significant at 5% level Notes: N=1016; 2=292.39; LnL=-525.44; 74% correct predictions
Summary Observations: • Sample concerned with red tide mostly due to health issues • Knowledge of safety of seafood consumption during red tide events lacking • Sample prefers biological to chemical • Sample prefers prevention strategies
Future Steps • Ordered model: recode binary response variable using respondent’s level of certainty • Probit or other distributions • Functional forms and interaction terms • Follow up phone interviews
Comments? Kristen Lucas Dr. Sherry Larkin Dr. Chuck Adams