Download
1 / 26
280 likes | 982 Vues
Unit 2: Supply, Demand, and Consumer Choice. Do you see the cow?. Review. Explain the Law of Demand Explain the Law of Supply Identify the 5 shifters of demand Identify the 6 shifters of supply Define Subsidy Explain why price DOESN’T shift the curve Define Equilibrium Define Shortage

E N D
Unit 2: Supply, Demand, and Consumer Choice Do you see the cow?
Review • Explain the Law of Demand • Explain the Law of Supply • Identify the 5 shifters of demand • Identify the 6 shifters of supply • Define Subsidy • Explain why price DOESN’T shift the curve • Define Equilibrium • Define Shortage • Define Surplus • Identify 10 stores in the mall
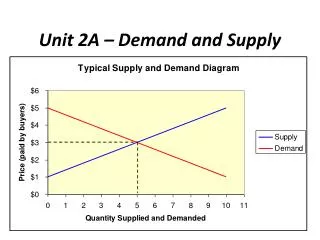
Supply and Demand are put together to determine equilibrium price and equilibrium quantity P Supply Schedule Demand Schedule S $5 4 3 2 1 D o Q 10 20 30 40 50 60 70 80 4
Supply and Demand are put together to determine equilibrium price and equilibrium quantity P Supply Schedule Demand Schedule S $5 4 3 2 1 Equilibrium Price = $3 (Qd=Qs) D o Q 10 20 30 40 50 60 70 80 Equilibrium Quantity is 30 5
Supply and Demand are put together to determine equilibrium price and equilibrium quantity What if the price increases to $4? P Supply Schedule Demand Schedule S $5 4 3 2 1 D o Q 10 20 30 40 50 60 70 80 6
At $4, there is disequilibrium. The quantity demanded is less than quantity supplied. P Supply Schedule Demand Schedule S $5 4 3 2 1 Surplus (Qd<Qs) How much is the surplus at $4? Answer: 20 D o Q 10 20 30 40 50 60 70 80 7
How much is the surplus if the price is $5? What if the price decreases to $2? P Supply Schedule Demand Schedule S $5 4 3 2 1 Answer: 40 D o Q 10 20 30 40 50 60 70 80 8
At $2, there is disequilibrium. The quantity demanded is greater than quantity supplied. P Supply Schedule Demand Schedule S $5 4 3 2 1 How much is the shortage at $2? Answer: 30 Shortage (Qd>Qs) D o Q 10 20 30 40 50 60 70 80 9
How much is the shortage if the price is $1? P Supply Schedule Demand Schedule S $5 4 3 2 1 Answer: 70 D o Q 10 20 30 40 50 60 70 80 10
The FREE MARKET system automatically pushes the price toward equilibrium. P Supply Schedule Demand Schedule S $5 4 3 2 1 When there is a surplus, producers lower prices When there is a shortage, producers raise prices D o Q 10 20 30 40 50 60 70 80 11
Assume shifts in supply or demand change equilibrium P and Q instantaneously 13
Easy as 1, 2, 3 • Before the change: • a. Draw supply and demand • b. Label original equilibrium price and quantity • The change: • a. Did it affect supply or demand first? • b. Which determinant caused the shift? • c. raw increase or decrease • After change: • a. Label new equilibrium? • b. What happens to Price? (increase or decrease) • c. What happens to Quantity?(increase or decrease) Let’s Practice! Supply and Demand Analysis
Analyze Hamburgers Price of sushi (a substitute) increases New grilling technology cuts production time in half Price of burgers falls from $3 to $1. Price for ground beef triples Human fingers found in multiple burger restaurants. S&D Analysis Practice • Before Change (Draw equilibrium) • The Change (S or D, Identify Shifter) • After Change (Price and Quantity After)
Double Shifts • Suppose the demand for sports cars fell at the same time as production technology improved. • Use S&D Analysis to show what will happen to PRICE and QUANTITY. • If TWO curves shift at the same time, EITHER price or quantity will be indeterminate.
Voluntary Exchange In the free-market, buyers and sellers voluntarily come together to seek mutual benefits.
Voluntary Exchange In the free-market, buyers and sellers voluntarily come together to seek mutual benefits.
Voluntary Exchange In the free-market, buyers and sellers voluntarily come together to seek mutual benefits.
Voluntary Exchange In the free-market, buyers and sellers voluntarily come together to seek mutual benefits.
Example of Voluntary Exchange Ex: You want to buy a truck so you go to the local dealership. You are willing to spend up to $20,000 for a new 4x4. The seller is willing to sell this truck for no less than $15,000. After some negotiation you buy the truck for $18,000. Analysis: Buyer’ Maximum- Sellers Minimum- Price- Consumer’s Surplus- Producer’s Surplus- $20,000 $15,000 $18,000 $2,000 $3,000
Voluntary Exchange Terms Consumer Surplus is the difference between what you are willing to pay and what you actually pay. CS = Buyer’s Maximum – Price Producer’s Surplus is the difference between the price the seller received and how much they were willing to sell it for. PS = Price – Seller’s Minimum
Consumer and Producer’s Surplus • Calculate the area of: • Consumer Surplus • Producer Surplus • Total Surplus P $10 8 6 $5 4 2 1 S CS • CS= $25 • PS= $20 • Total= $45 PS D 2 4 6 8 10 Q