Download
1 / 82
880 likes | 1.19k Vues
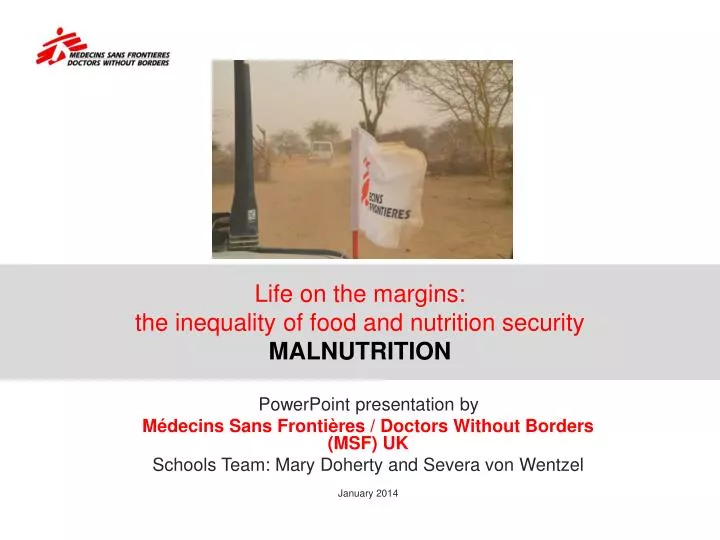
Life on the margins: the inequality of food and nutrition security MALNUTRITION. PowerPoint presentation by Médecins Sans Frontières / Doctors Without Borders (MSF) UK Schools Team: Mary Doherty and Severa von Wentzel January 2014. Awareness ribbon for malnutrition Image: Wikipedia.

E N D
Life on the margins: the inequality of food and nutrition securityMALNUTRITION PowerPoint presentation by Médecins Sans Frontières / Doctors Without Borders (MSF) UK Schools Team: Mary Doherty and Severa von Wentzel January 2014
Awareness ribbon for malnutrition Image: Wikipedia Malnutrition: Undernutrition
“With diseases related to malnutrition on the rise, the challenge is not only to ensure food security, but also to address the nutritional quality of the food being consumed and its impact on health.” - Dr Frenck G20 2012, http://www.who.int/pmnch/media/press_materials/pr/2012/201205_g20_watch/en/index4.html
Malnutrition terms Adequate food is at the basis of an active and healthy life. Yet, in spite of significant improvements, millions of people today are malnourished. Malnutrition: An abnormal physiological condition caused by inadequate, unbalanced or excessive consumption of macronutrients and/or micronutrients. Malnutrition includes undernutrition and overnutrition as well as micronutrient deficiencies. Minimum dietary energy requirement (MDER): amount of energy needed for light activity and a minimum acceptable weight for attained height. Body Mass Index (BMI) relates weight to height and is used to evaluate thinness and obesity. Source: ftp://ftp.fao.org/docrep/fao/012/i0876e/i0876e02.pdf World bank, Scaling up Nutrition: What will it cost? 2010 http://siteresources.worldbank.org/HEALTHNUTRITIONANDPOPULAION/Resources/Peer-ReviewedPublications/ScalingUpNutrition.pdf
Malnutrition terms Protein-energy malnutrition: BMI and shortness are indicators. A broad (older) term from the 1970s when protein deficiency was felt to be the primary driver behind malnutrition. Replaced by the more general term ‘acute malnutrition’ which includes macronutrient imbalance/insuffiency as well as micronutrient deficiency. Micronutrient deficiency: “hidden hunger”, a lack of one or more essential vitamins and minerals, such as Vitamin A, iron, iodine or zinc. Indicator iron-deficiency anaemia low haemoglobin in blood. Micronutrient powders (MNP) are used to prevent micronutrient deficiencies; for example, on a large-scale basis in Bangladesh.
Undernutrition Poor health, growth and development outcomes can result from hunger and poor nutrition. Under nutrition is “the outcome of undernourishment, and/or poor absorption and/or poor biological use of nutrients consumed as a result of repeated infectious disease. It includes being underweight for one’s age, too short for one’s age (stunted), dangerously thin for one’s height (wasted) and deficient in vitamins and minerals (micronutrient malnutrition).(FAO definition http://www.fao.org/hunger/en/) Under nutrition includes being: • Underweight: a child has low weight for age. Composite measure includes chronic and acute malnutrition. • Stunting: child short for their age as a result of chronic under nutrition during the most critical periods of growth and development in early life. • Wasting: child’s weight is too low for their height as a result of acute under nutrition, can vary with the seasons. Reflects loss of muscle tissue and fat. • Kwashiorkor: sudden onset swelling of the feet, hands and face. Cause unknown, but occurs typically in children 2-3 years old once they are weaned from breast milk and can be cured by feeding a specially fortified milk. Form of severe malnutrition.
Undernourishment Famine Undernourishment or chronic hunger: A state, lasting for at least one year, of inability to acquire enough food, defined as a level of food intake insuffiecient to meet dietary energy requirements. For the purposes of this presentation, hunger was defined as being synonymous with chronic undernourishment. Famineis the state in which significant proportion (at least 20%) of a defined population lacks access to food in sufficient quantity and quality, such that epidemics of infectious disease become more frequent, acute malnutrition rates in children under 5 are above 30% and death rates rise. In famine conditions, the most vulnerable members of the population - the very young, the elderly and those with chronic illness – are at higher risk of death.
Starvation Starvation occurs when the individual’ nutrient intake drops below what is needed to maintain body mass and the body begins to consume muscle and other lean tissues in order to supply nutrients to maintain metabolic function. In an otherwise well adult who continues to drink water but ceases all nutrient intake, this process of starvation leads to death in about 2 months. The process of starvation affects all the body’s organ systems, but the most visible signs are weakness, apathy and muscle wasting.
Hunger IQ and FAQs Action for students: • With a partner test your Hunger IQ: http://www.wfp.org/hunger/faqs and read Hunger Frequently asked questions (FAQs) including the overview, record what is hunger, who are the hungry, what causes hunger, what is malnutrition? • Extract the salient information from each of the documents and individually record the information so you can readily refer to it. • Can you explain why solving hunger is regarded as a ‘best buy’ in today's tough economy? 4. Use the data from Who are the hungry? • Draw a bar chart showing how the 870 million hungry people in the world are distributed. • Draw a pie chart which shows the proportion of hungry people living in rural areas. • Draw another pie chart showing the proportion of hungry people from small holding farming communities, those from landless families dependent on farming and the proportion dependent on herding, fishing or forest resources.
Hungercase studies Action for students: • Look through Hunger in the news http://www.wfp.org/news/hunger-in-the-news 2. Make brief notes on the current hunger crises and debates around the globe paying particular attention to the case studies used in this unit: • The Sahel (Sub-Saharan Africa ) • Bangladesh, India (South Asia) • Kenya • The UK • The USA • What is in the news about these case studies, malnutrition and life on the margins? Add helpful information to your notes. “Every man, woman and child has the inalienable right to be free from hunger.” - First World Food Conference Declaration, Rome, 1974
World economic growth and undernourishment Agriculture plays an essential role in the world economy. Beyond food production, it is as an engine of economic growth key to growth in rural settings and poverty reduction in transition countries. It generally accounts for half of GDP in developing countries; its share in the economy tends to decline with development. Investments in agriculture have a poverty-reduction impact larger than any other sector. K Source: Fairfood http://www.fairfood.org/wp-content/uploads/2012/12/Fairfood-International-Strategy_Final.pdf http://www.fao.org/publications/sofi/en/
Rise in hungry people Number of hungry people, 1969-2010 Since 1995-97 the number of hungry people has risen. Even at times of economic growth and low food prices, the number of hungry has not fallen below around 800 million over the past 40 years. Source: FAO; Source: http://www.worldhunger.org/articles/Learn/world%20hunger%20facts%202002.htm;
Factors in rise of hungry people Factors: 1. Governments and international agencies have neglected agriculture and the synergy between agriculture and social protection relevant to very poor people; for every five people suffering from hunger, three rely on farming. Women and small holder farmers most affected. Food reserves have also shrunk. • Current worldwide economic crisis and financial, trade and policy issues; • Energy and climate issues; 4. Devastating impact of food price hikes, a large upward movement in price in a short time, on people existing on only a few dollars a day. 5. Speculation and concentration of agribusiness* and retail among very few players. * Agribusiness: the manufacture and distribution of farm supplies,; farm production operations, storage, processing and distribution of farm commodities and products most often by corporations. Source: FAO; Source: http://www.worldhunger.org/articles/Learn/world%20hunger%20facts%202002.htm;
K Source: http://www.fao.org/publications/sofi/en/
Global Hunger Index International Food Policy Research Institute Action for students: Note the three dimensions of which the GHI is composed in your folder along with the main trends per region. K Prevalence: proportion of people in a population with a particular disease at a specified point in time or over a specified period of time– as opposed to new cases which is incidence Rate“A measure of the intensity of the occurrence of an event. For example, the mortality rate equals the number who die in one year divided by the number at risk of dying. Rate—A measure of the intensity of the occurrence of an event.“(http://www.idph.state.ia.us/hpcdp/common/pdf/10_glossary.pdf
Hunger and Nutrition Commitment Index Further info: Community voices from Bangladesh: http://www.hancindex.org/community-voices/#.Uke2HoaThuI Source: http://www.hancindex.org/hanci2012/HANCI%202012%20infographic.pdf
How to measure malnutrition • Anthropometry • Weight • Length or height • Middle upper arm circumference • Weight and height must be compared to age or to each other and therefore are turned into indices • Weight for age called ‘underweight’. Includes both wasting and stunting • Weight for length or body mass index, measure of ‘wasting’ and ‘obesity’ • Height for age, measure of ‘stunting’ • Other signs or measures a. Oedema (water retention) of feet, hands, face b. Blood test for anemia (iron deficiency in particular) c. Blood test for certain micronutrients: Vitamin A or zinc
How malnutrition kills • The commonest form of malnutrition called marasmus results in an affected child being severely wasted, with no fat and very little muscle tissue left on his or her body. The internal organs, including the heart and the blood, are also weakened. The child is left with no reserves to fight infection, and any illness that comes along is likely to be fatal. The commonest causes of death during a famine are in fact infectious diseases, rather than starvation per se. Chief among these are pneumonia, diarrhoea, and measles. • UNICEF on Marasmus http://www.unicef.org/nutrition/training/2.3/4.html • The other form of malnutrition, called kwashiorkor, in which the child's body is swollen, likewise kills by lowering resistance to infection. However, kwashiorkor can also be fatal in its own right, because of the disturbed levels of salts and minerals (electrolyte imbalances) that accompany it. • In a therapeutic feeding centre, where only severely malnourished children are cared for, many deaths tend to occur at night. This is because these children are especially prone to low blood sugar (hypoglycaemia) and low body temperature (hypothermia). (MSF US website) • Clip on Kwashiorkor http://www.youtube.com/watch?v=V4AxkjP4krU
Determinants of child nutrition and development Immediate determinants include: • Adequate food and nutrition intake • Parenting, caretaking and feeding practices • Low burden of infectious diseases Underlying determinants include: • Food and nutrition security • Adequate resources at the community, household and maternal (mother’s) level • Access to health care provision • Safe and hygienic environment Source: http://download.thelancet.com/flatcontentassets/pdfs/nutrition_4.pdf
The wrong start One out of six children -- roughly 100 million -- in developing countries are underweight, but trend is down. Source: Global health Observatory, WHO, 2011 Source: Unicef Nutrition Report 2013 and World bank http://passthrough.fw-notify.net/download/589313/http://data.worldbank.org/sites/default/files/wdi-2013-ch1.pdf
Wasting and stunting When a population is short this points to nutritional deprivation or disease in childhood. Image:http://www.bing.com/images/search?q=Forms+Of+Malnutrition&Form=IQFRDR#view=detail&id=8D2A19491AEE9E080EF2302D4FD4004D2EA0FB5&selectedIndex=2; http://download.thelancet.com/flatcontentassets/pdfs/nutrition_2.pdf
A STUNTED IN CHILD • has lower chances of survival and • less optimal health and growth. • has greater propensity for developing obesity and chronic diseases as an adult, fuelling obesity epidemic in low and medium income countries. • is more likely to have been born to a mother with poor nutrition and health status, which perpetuates • vicious cycle of under nutrition and poverty. International health organisations are starting to shift their focus from underweight prevalence (inadequate weight for age) to prevention of stunting (inadequate length / height for age). Source: http://www.unicef.org/media/files/nutrition_report_2013.pdf Image:http://ble.lshtm.ac.uk/pluginfile.php/20037/mod_resource/content/47/OER/PNO101/sessions/S1S17/PNO101_S1S17_030_010.html Image: http://challengedkidsinternational.files.wordpress.com/2013/03/stunting-in-children_50291a07a181b.jpg
Stunting prevalence by region Globally, about 1 in 5 (26% in 2011) children are stunted of whom 80% live in 40 countries. Undernutrition affects poor children most, but rates are high enough to deserve attention even among the better-off children in developing countries. South Asia Sub-Saharan Africa Middle-East / North Africa East Asia / Pacific Latin America / Caribbean CEE / CIS Developing countries * Prevalence is the proportion of the population that has a condition of interest at a specific point in time. Source: http://www.unicef.org/progressforchildren/2007n6/images/pfc6_prevalence_stunting_children_under_five.gif; A Ergo et al “What difference do the new WHO child growth standards make for the prevalence and socioeconomic distribution of undernutrition?” Food Nutrition Bulletin http://www.ncbi.nlm.nih.gov/pubmed/19445255
Stunting in children and income growth Improvements in nutritional status lag behind economic growth, but are boosted by income growth. Source: http://download.thelancet.com/flatcontentassets/pdfs/nutrition_4.pdf
Silent emergencyof stunting Action for students: • With a partner use the resources below and others to research the trends of malnutrition prevalence since 1980. 2. Explain the reasons why some have shifted their focus from underweight to stunting . 3. From your research explain the title-The silent emergency of stunting 4. Find out about and write a brief paragraph on the Scaling Up Nutrition (SUN) Movement. • Malnutrition prevalence, weight for age (% of children under 5) Map from 1980 in 4 year segments up to 2012. http://data.worldbank.org/indicator/SH.STA.MALN.ZS/countries?display=map • “Improving Child Nutrition - The achievable goal for Global Progress”www.unicef.org/media/files/nutrition_report_2013.pdf • “Break the cycle of stunting": http://www.impatientoptimists.org/Posts/2013/04/Hunger-and-Poverty-Still-Core-to-the-MDG-Agenda • “The Life cycle of malnutrition”http://www.ifpri.org/publication/life-cycle-malnutrition Clip on Cycle in South Asia http://www.thp.org/node/575 • Trendalyzer video / presentation on 1000-day window, cycle and initiatives: http://scalingupnutrition.org/resources-archive/videosmultimediaand • “A Life Free from Hunger” on the life-long consequences of stuntinghttp://www.savethechildren.org.uk/sites/default/files/docs/A-Life-Free-From-Hunger-UK-low-res.pdf
Source: 1000 days.org infographic What causes maternal and child malnutrition http://www.thousanddays.org/resource/infographic-what-causes-maternal-and-child-malnutrition/
What is at the root of the problem? Further infoon where the poor live and are going to live? Free exchange: The geography of poverty”, The Economist September 1st 2012, http://www.economist.com/node/21561878 Image: 1000 days.org infographic What causes maternal and child malnutrition http://www.thousanddays.org/resource/infographic-what-causes-maternal-and-child-malnutrition/
Childhood malnutrition:causes, campaign and Sahel (1) The mother’s status (is she disadvantaged?) is likely to affect the child’s food intake and health status – both proximate determinants of the child’s nutritional status. Causes of malnutrition include: • poverty, • quality of environmental conditions (poor housing conditions, inadequate water, hygiene practices and sanitation), • illiteracy, • unemployment, • social problems • poor awareness about mal/nutrition • poor access or quality of health services. Source: World Health Organization. Management of severe malnutrition: a manual for physicians and other senior health workers. Geneva, Switzerland: WHO,1999: http://whqlibdoc.who.int/hq/1999/a57361.pdf Accessed November 2012.
Childhood malnutrition:causes, campaign and Sahel (2) Action for students: • Make notes in your folder from the nutrition glossary: http://www.unicef.org/lac/Nutrition_Glossary_(3).pdf • Watch the “Rewrite the Story” clip on MSF’s campaign to make childhood malnutrition more visible on the global agenda and in people’s minds. What are the main arguments? http://www.starvedforattention.org/ • Time to prevent malnutrition in the Sahel (on Malaria and Malnutrition) http://reliefweb.int/report/mali/time-prevent-child-malnutrition-sahelMSF 4. Report Malnutrition in the Sahel: One Million Children Treated – What’s Next? http://www.doctorswithoutborders.org/publications/reports/2012/Sahel_Briefing_Document.pdf 5. Sahel: Treating malnutrition. http://www.youtube.com/watch?v=nKQkp1qGFp0
Girls and women • The distribution of malnutrition is highly gendered, girls and women make up more than 70% of the world’s hungry (UN). • Girls and women produce more than 55% of the world’s food supply (UN). They endure lower salaries, fewer promotions, less secure employment, unreasonably long hours whilst continuing with traditional household responsibilities. • They represent 41% of farmers around the world; own only 2% of the land (Rural Poverty Portal) • Women in Africa receive less than 10% of all credit going to small farmers, and only 1% of the total credit going to the agricultural sector (Rural Poverty Portal) Source: http://www.un.org/ecosocdev/geninfo/women/women96.htm;; http://www.ruralpovertyportal.org/web/guest/topic/home/tags/gender;; http://download.thelancet.com/flatcontentassets/pdfs/nutrition_2.pdf
Women’s empowerment (1) Women’s health and nutrition, equality and empowerment are worthwhile ends in themselves. In addition they have many benefits, including: • Intergenerational benefits • Poverty reduction • Economic efficiency In many settings, greater access to agricultural lands and economic rights are needed for women to exploit the synergy between agriculture and social protection. Source: http://elibrary.worldbank.org/content/book/9780821329 17 Image:http://stuartbramhall.aegauthorblogs.com/2012/ 3/08/thefemaleface-of-poverty/
Women’s empowerment (2) “Gender-based inequalities at every point in the value-chain have traditionally impeded the realization of food and nutritional security.....In most developing countries women play a key role in the cultivation of food and cash crops as well as the nutritional care of their children and are therefore critical to food and nutritional security. Investment in women can lead to tremendous dividends.” According to the Lancet, evidence supports that women and men allocate food differently. There are: • Positive associations between women’s empowerment and improved maternal and child nutrition. • Negative associations between disempowerment such as domestic violence and child nutrition outcomes • Positive impacts on women’s empowerment of agricultural programmes and cash transfers Source: http://www.interaction.org/sites/default/files/5649/G8%20Background%20policy%20brief%20FINAL%20FS-AG-N%203-19-12%20(updated).pdf; The lancet “Nutrition-sensitive Interventions and Programmes: How Can They Help Accelerate Progress in Improving Maternal and Child Nutrition?” http://download.thelancet.com/flatcontentassets/pdfs/nutrition_4.pdf
Women’s inequalitydrives the cycle • Gender“refers to the socially constructed roles behaviour, activities and attributes that a particular society considers appropriate for men and women.” Not inherently given by biology, these vary across cultures. • “The distinct roles and behaviour may give rise to gender inequalities, i.e. differences between men and women that systematically favour one group. In turn, such inequalities can lead to inequities between men and women in both health status and access to health care.” (http://www.who.int/topics/gender/en/) • Gender equality “implies a society in which women and men enjoy the same opportunities, outcomes, rights and obligations in all spheres of life.” (http://www.unfpa.org/gender/empowerment.htm) • Gender equity Process of being fair to men and women alike that leads to equality. • Gender empowerment: “A critical aspect of promoting gender equality is the empowerment of women, with a focus on identifying and redressing power imbalances and giving women more autonomy to manage their own lives. Women's empowerment is vital to sustainable development and the realization of human rights for all.”
Women’s inequalityand food and nutritional security Image gender cycle: http://www.srfood.org/images/stories/pdf/officialreports/20130304_gender_en.pdf;
Feast or Famine Action for students: 1. Watch the interactive slideshow on nutrition emergencies and classification: http://www.unicef.org/nutrition/training/2.2/17.html 2. Discuss in pairs: what is the difference between hunger, malnutrition, starvation and famine. Make sure you have a clear definition of each of these words recorded in your folder. 3. Explain why there is malnutrition in LEDCs. 4. What do you believe the phrase ‘Feast or Famine’ means?
Bangladesh and India Action for students: Label the map with countries, main cities, bodies of water. 2. Watch “Terrifying Normalcy” of malnutrition in Bangladesh – http://www.starvedforattention.org/ 3. Record key data and information for your case study on Bangladesh and India 4. What do you understand is meant by the title of the video.? Why is it terrifying? Source: http://www.bing.com/images/search?q=blank+Geography+Map+India+Bangladesh&id=BCE5584B708006B5BF07A0FE628648876E137988&FORM=IQFRBA#view=detail&id=79839EF8E449104CDCA5A1006380F42383FB8E27&selectedIndex=1
Malnutrition in South Asia “Among all regions, South Asia has the worst record on malnutrition... In developing countries, on average, 29 per cent of children are underweight; In South Asia it is 49 per cent. Thirty-three [of] children in developing countries are stunted; but 48 per cent in south Asia are. Ten per cent of children in the developing world are wasted; the share is 17 per cent in south Asia ... [but] child survival rates in south Asia [are] so much better than in SSA....the south Asian child usually has better access to modern medical care, especially antibiotics” – SantoshMehrotra,“Child Malnutrition and Gender Discrimination in South Asia”; Economic and Political, Weekly March 11, 2006 Image: http://www.msf.org.uk/country-region/bangladesh
Bangladesh profile (1) • In South Asia, Bangladesh urbanisation (highest rate in South Asia) is largely driven by rural-urban migration, which gained in momentum after the country’s independence in 1971. The capital Dhaka has most dominant role. • Half of its population of 163,654,860 (July 2013 est., CIA World Factbook) live in poverty and about one third in extreme poverty, so third largest number after China and India. Poor access to food due to poverty. • Between 1990 and 2010 poverty rates declined substantially with per capita GDP doubling and economic growth appearing to have reached the poor; agricultural growth averaged 3.3% a year thanks to great gains in rice yields (FAO 2012). Source:* SantoshMehrotra,“Child Malnutrition and Gender Discrimination in South Asia”; Economic and Political Weekly March 11, 2006 http://hdr.undp.org/en/reports/global/hdr2013/download; http://www.thehungerproject.co.uk/wherewework/bangladesh/ CIA World factbookhttps://www.cia.gov/library/publications/the-world-factbook/geos/bg.html; http://www.fao.org/publications/sofi/en/
Bangladesh profile (2) • Most densely populated country in the world, 28.4% of total population is urban (2011). Overcrowding, especially intense in urban areas, makes environmental hygienic conditions worse, which leads to greater disease affecting absorption of nutrients. The socio-economic status of rural-urban migrants is moderately lower than their urban native counterparts. • Women in South Asia have the worst educational indicators relative to men with lowest adult literacy rates for women as a percentage of men (63%)* • Bangladesh has seen dramatic advances in child survival thanks to • economic, economic and political empowerment of women; and • higher participation of girls in formal education with literacy rates 38% in 1991 increasing to 77% in 2009 Source:* SantoshMehrotra,“Child Malnutrition and Gender Discrimination in South Asia”; Economic and Political Weekly March 11, 2006 http://hdr.undp.org/en/reports/global/hdr2013/download; http://www.thehungerproject.co.uk/wherewework/bangladesh/ CIA World factbookhttps://www.cia.gov/library/publications/the-world-factbook/geos/bg.html; http://www.fao.org/publications/sofi/en/
Bangladesh health profile “During pregnancy, they eat the same food. Whatever they are having now, they have the same then. Who will give them extra food? That’s why their children are weak and suffer from malnutrition; for which they do not do well in education like the children of the rich class. Who will get this fact?” Female, Nilphamari District, Bangladesh, HANCI report http://www.hancindex.org/about/#.UkfUl4aThuK • Share of government spending on health about double that of India and Pakistan, its large neighbours. • Twenty-five million face hunger. Hunger distribution is highly gendered with nearly one third of women undernourished (Ahmed, Mahfuz, Ireen et al 2012) • Second highest child malnutrition rates in the world with 48%, which is linked to low status of women in Bangladeshi society (circumscribed autonomy/agency). Husband and boys can be prioritised in food allocation. Mothers and daughters can have inadequate or low quality food and work requirements, leading to low health status. • Malnutrition, it is estimated, costs US$ 1 billion a year in lost economic productivity. • An estimated 50% reduction in undernourishment has been achieved (SUN 2011) Consumption of nutritious food appears to be on the increase. Source: http://www.fao.org/publications/sofi/en/
Bangladesh indicators Significant public health concern: Wasting16% prevalence beyond 15% emergency threshold. Levels of stunting 41% and underweight 36% (2011 figures, according to UN definition) K Source: http://www.fao.org/publications/sofi/en/; http://opendocs.ids.ac.uk/opendocs/bitstream/handle/123456789/2955/ER25%20Final%20Online.pdf?sequence=1_source=hanci
India case study: country profile sources Action for students: Using the previous slide on Bangladesh as a template for a country profile, distil relevant facts pertaining to the population’s well-being in general and malnutrition in particular. Why do studies look at the level of the mother’s education? • CIA World Factbook, Measure DHS (demographic and health surveys), World Bank and BBC Country Profiles are good starting points • https://www.cia.gov/library/publications/the-world-factbook/geos/ha.html • http://www.measuredhs.com/ • http://www.worldbank.org/ • http://news.bbc.co.uk/2/hi/country_profiles/
Nutritional status:Bangladesh and India • Percentage of children under 5underweight (this is a nutritional indicator for the whole community) among highest in the world 2nd for India and 4th for Bangladesh (World Factbook); stunting prevalence 41.3% in Bangladesh in 2011 (Measure DHS) • Among lowest adult obesity prevalence rate in the world 184th for India and 190th for Bangladesh in the world, but alarming rise in BMI over 25 for women in Bangladesh from 12% in 2007 to 17% in 2011 Bangladesh • Childhood under nutrition has declined, but maternal nutrition has not improved significantly in Bangladesh (http://www.measuredhs.com/pubs/pdf/PB6/PB6.pdf) • Anaemia continues to be a major nutritional problem in children and women in Bangladesh India Action for students: • Note some of the issues arising from the fact that the latest data for India dates back to a 2005-2006 national family health survey http://www.measuredhs.com/pubs/pdf/OD56/OD56.pdf • Record the relevant points for your folder from “UNICEF Nutrition in India” http://www.unicef.org/india/nutrition.html FAO Country India Nutrition profile http://www.fao.org/ag/agn/nutrition/ind_en.stm Source: CIA World factbookhttps://www.cia.gov/library/publications/the-world-factbook/rankorder/2228rank.html?countryname=Bangladesh&countrycode=bg®ionCode=sas&rank=190#bg) (http://articles.timesofindia.indiatimes.com/2013-06-29/india/40271375_1_nutritional-status-addressing-malnutrition-lancet-series
“Malnutrition, both under and over, can no longer be addressed without considering global food insecurity, socioeconomic disparity, both globally and nationally, and global cultural, social and epidemiological transitions.” - Darnton-Hill and ET Coyne “Feast and famine: socioeconomic disparities in global nutrition and health” http://journals.cambridge.org/download.php?file=%2FPHN%2FPHN1_01%2FS1368980098000068a.pdf&code=cac6fec0a6e8779ed4063bbf512011e1
Double burden ofmalnutrition (1) Double burden of malnutrition: Persistence of under nutrition, especially among children, along with rapidly increasing overweight, obesity and diet- and life-style related chronic diseases especially among the poor. In China, for example, there has been a significant rural-urban difference in obesity prevalence which offset marked reductions in underweight prevalence. These forms of malnutrition usually result from uneven access to food and unbalanced diets. Both under- and over-nutrition are problems of poverty and are bound to become even more closely interwoven. Immediate and root causes of malnutrition are multidimensional and complex.
Double burden of malnutrition (2) In countries where famine and under nutrition were traditionally the main issue, the reverse now is the case: over nutrition is increasing, especially in India and China, countries recently more affluent. In developing countries, rapid urbanisationis linked to diets with more fats, animal source foods and processed products and lower activity levels resulting in higher levels of obesity. (ftp://ftp.fao.org/docrep/fao/009/a0442e/a0442e00.pdf) Action for students: Write a few paragraphs for your folder explaining what is meant by the phrase “the double burden of malnutrition.”
Nutritional adequacy • Energy – provided in the form of protein, carbohydrates and fats. Sometimes referred to as macro-nutrients. • Micronutrients – vitamins and minerals essential to all metabolic processes in the body. Fruits and vegetables are rich in micronutrients, as are many animal sourced foods. Liver is an excellent source of iron, B vitamins and Vitamin A. • Animal sourced food – meat, fish, eggs, dairy. These foods provide complete protein and many micronutrients in addition. For example, dairy foods provide complete protein, an excellent source of calcium, zinc and essential fats. • Tubers and cereal – the least expensive source of energy, predominately carbohydrates. Also provide some protein and often rich in B vitamins. However, protein is usually not complete and these foods must be paired with beans or lentils to provide all the essential amino-acids (protein-building blocks).