Download
1 / 32
320 likes | 493 Vues
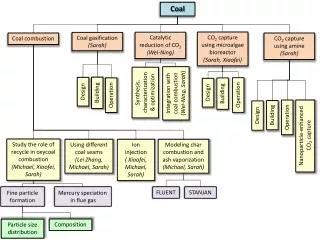
Gambling with Coal How Future Climate Laws Will Make New Coal Power Plants More Expensive. Barbara Freese, Attorney and Consultant Steve Clemmer, Clean Energy Research Director Union of Concerned Scientists October, 2006. Overview of the Arguments:. The Science The Emerging Policy Response

E N D
Gambling with CoalHow Future Climate Laws Will Make New Coal Power Plants More Expensive Barbara Freese, Attorney and Consultant Steve Clemmer, Clean Energy Research Director Union of Concerned Scientists October, 2006
Overview of the Arguments: • The Science • The Emerging Policy Response • International • State and local • Congressional • Changing Attitudes within the Power Industry • Changing Attitudes on Wall Street • Impact of CO2 Laws on Cost of Coal Power • Ratepayers Should Not Have to Bear Imprudently Incurred Costs
Highlighting the Science: • Powerful scientific consensus on global warming • Damage already occurring • Much worse lies ahead, including risk of abrupt changes • Steep reductions(60-80% by 2050) needed to avoid dangerous warming: CA, NM, EU, UK, New England Governors and Eastern Canadian Premiers Arctic sea ice in 1979 Arctic sea ice in 2003
Policy Response - Global • Kyoto and Beyond: US isolated and under pressure to act • EU cap-and-trade system • G8 agreement
Policy response – state and local • Regional Greenhouse Gas Initiative (RGGI) cap and trade model rule • California CO2 Cap • CO2 “adder” in energy planning • performance standard under development • motor vehicle standard • Renewable Energy Standards in 20 states plus DC • covering 40% of US electricity • Local efforts • 270 cities (48 million Americans) aiming to reach Kyoto targets and pressure federal government for emissions trading
Sense of the Senate Resolution • “It is the sense of the Senate that Congress should enact a comprehensive and effective national program of mandatory, market-based limits and incentives on emissions of greenhouse gases...” • adopted June 22, 2005, supported by 54 Senators • co-sponsored by: Bingaman (D-NM), Specter (R-PA), Byrd (D-WV), Domenici (R-NM) • Bingaman & Domenici White Paper and hearings on regulatory design elements • Similar resolution passed by House Appropriations Committee in 2006
Seven cap-and-trade proposals: • Sens. McCain/Lieberman • Sen. Bingamen (National Commission on Energy Policy) • hearings by Senate Energy and Natural Resources Committee • Sen. Carper • Reps. Udall/Petri • Sen. Feinstein • Sen. Jeffords* • Reps. Waxman/Hinchey* *seek to reduce CO2 emissions to 80% below 1990 levels by 2050
Cap-and-trade systems • national CO2 cap set and allowances issued • plant operators would need to own CO2 allowances • allowances are traded among operators, with allowance price set by market forces • widely support for cap-and-trade within industry, even evangelical Christian “Call to Action”
Coal power targeted by all bills: • Coal plants are responsible for one-third of US CO2 emissions • Largest source category: more than from all cars, trucks, planes, and trains combined • 500 MW coal plant = 600,000 cars CO2 • EIA studies show reducing coal use is most cost-effective way to reduce CO2 • power plants account for 66-85% of reductions
Growing support by private sector • Five of nation’s top 10 power companies support CO2 cap-and-trade legislation: • Calpine, Duke, Entergy, Exelon, and FP&L • AEP, Southern and Xcel: oppose legislation but executives have said it’s coming, and they are trying to shape it • 2004 survey: • half of power executives expected CO2 laws within 5 years • 60% expected limits within 10 years • Wal-Mart, GE, Ford, many other major corporations supporting CO2 limits
Pressure from Investors: • Investor Network on Climate Risk • manages $3 trillion in assets • 5 times bigger than in 2003 • Carbon Disclosure Project (international) • manages $31 trillion in assets • Major Banks and Investment firms analyzing CO2 risk, trying to reduce exposure • Bank of America • JP Morgan Chase • Lehman Brothers • Citigroup
Why Is CO2 Risk Being Ignored? • IOUs believe they can pass costs on to ratepayers? • History and ratemaking principles suggest otherwise • Last major base-load construction boom in US resulted in • abandoned nuclear power plants • lots of excess capacity coal plant
Shareholders versus ratepayers • Two lines of case law suggest shareholders should bear risk for investment mistakes • Prudent investment: was the decision to invest -- and to keep investing when circumstances changed -- prudent when made? If not, no rate recovery • Shared costs: even if the decision was prudent, shareholders should bear some of the costs of the unsuccessful investment • Focus on creating ongoing incentive to reevaluate investment decision
Put Utilities on Notice: • If a coal plant is approved, utility should be warned that it is at risk from future CO2 regulations • Importance of creating ongoing incentive for utilities to watch development of CO2 issue • Big Stone II utilities, led by Otter Tail Power, claimed not to have given CO2 limits much thought • Had no opinions about when future regulations likely
Utilities expect grandfathering? • Betting allowances would be allocated, not auctioned • Betting allocation would cover upcoming plants • Dangerous gamble: • opposition to full allocation in RGGI states • opposition to allocation in Domenici/Bingamen White Paper • would be rewarding utilities that purposely increase exposure by building coal plants after Senate resolution • Wall Street, western utilities, western states see future CO2 regulations as new costs, not windfall
Utilities are increasinglyevaluating carbon risk • 7 of 12 western utilities considered carbon risk in latest resource plans, representing 30% of western electricity supply • 10 of 12 plans will consider in next round: 42% of western electricity • CA PUC requires utilities to include “adder” • $8/ton initially rising at 5% year • Required to include in long-term planning and evaluating bids Sources: LBL, Balancing Cost and Risk: The Treatment of Renewable Energy in Western Utility Resource Plans, August 2005; CA PUC Decision No. 04-12-048 December 2004, and revised decision in April 2005..
Methods and Approach toCarbon Risk Evaluation Vary Lawrence Berkeley Lab recommends that… • all utilities evaluate carbon risk • a greater level of consistency in evaluation approaches be sought • a broad range of possible regulatory environments be considered Source: LBL, Balancing Cost and Risk: The Treatment of Renewable Energy in Western Utility Resource Plans, August 2005.
CO2 is important component of environmental regulatory risk Environmental regulations are likely to change over the lifetime of electric supply investments, and utility planning should evaluate these risks, and mitigate them if cost-effective to do so PacifiCorp 2004; data for 2015 Risk of carbon regulation – at the state or federal level – is likely the most important to consider, but risk of strengthened regulations of SO2, NOx and mercury also deserve note Source: LBL, Balancing Cost and Risk: The Treatment of Renewable Energy in Western Utility Resource Plans, August 2005.
What is the cost of CO2 limits?Recent Market Prices in Europe Source: EU: PointCarbon.com using an average exchange rate for 2005 of 1.25 US dollars per euro
What is the costof future CO2 limits in the US? Source: Synapse Energy Economics, Climate Change and Power: Carbon Dioxide Emissions Costs and Electricity Resource Planning, May 2006.
CO2 prices greatly increasecost of coal power Pulverized Coal costs in 2015 under various CO2 prices 100 90 80 Synapse High 70 $30.80/ton, $77.11/MWh Synapse Mid 60 $19.60/ton, $66.34/MWh Levelized cost of Generation ($/MWh) Synapse Low 50 $8.50/ton, $55.67/MWh 40 30 20 10 0 0 10 20 30 40 50 Cost of CO2($/short ton) Source: EIA, “NEMS EMM Factors for AEO06,” spreadsheet, 2006, and Synapse, 2006. The costs are representative of a new coal plant built in the Midwest in 2015.
Levelized Cost of Electricity $100 No CO2 Cost $90 Low CO2 Cost ($7.80/ton) $80 Mid CO2 Cost ($19.10/ton) $70 High CO2 Cost ($30.50/ton) $60 2005$/MWH $50 $40 $30 $20 $10 $0 Coal 600 MW Wind 1200 MW Wind 1200 MW +NGCC 300 MW +NGCC 300 MW - No PTC - With PTC Wind-gas alternative is cheaper than proposed Big Stone II plant in South Dakota Source: Direct Testimony of David A. Schissel and Anna Sommer, Synapse Energy Economics, Application by Otter Tail Power Company on behalf of the Big Stone II Co-owners for a Energy Facility Siting Permit, Case No EL05-022, South Dakota Public Utilities Commission, May 26, 2006.
Reference case + 290 new coal plants (174 GW) Case 4 - 171 existing plants retired (103 GW): NO new PC coal; 17 GW of IGCC w/CCS EIA: Reducing carbon in electricity means replacing or decarbonising coal • National Commission Case 4 (2x rate of reductions; $49/ton ceiling) • Only scenario with overall carbon reductions • 10% power plant carbon reductions by 2021 • 44% by 2030 • Coal makes the difference Source: EIA, Energy Market Impacts of Alternative Greenhouse Gas Intensity Reduction Goals, March 2006. http://www.eia.doe.gov/oiaf/servicerpt/agg/pdf/sroiaf(2006)01.pdf
CO2 costs change economics of electricity generation options Coal Generation under Xcel’s Preferred Plan (Reference Case) and Carbon Regulatory Scenarios (GWh) • Xcel Energy’s 2004 IRP in MN included 1125 MW of new coal in its “Preferred Plan.” • When future CO2 costs were included in Xcel’s model, ALL THE NEW COAL GENERATION DISAPPEARED, even using CO2 costs lower similar to Synapse’s low case forecast. • New coal plants become uneconomic when CO2 regulations are included. Source: Xcel responses to IWLA/ME3/UCS/MCEA Information Requests 7d and 19b.
Costs have increased for all technologies Prices from Puget Sound Energy RFPs Source: Puget Sound Energy IRPAG, powerpoint presentation, June 22, 2006.
Increasing coal plant costs Source: Black & Veatch, MMEA presentation, Building New Baseload in the Midwest, May 11, 2006
Drivers for cost increases Source: Preliminary information developed by Black & Veatch for AWEA
Pulverized coal plant capital costs 2254 603 Big Stone II Revised (SD) 2500 Springfield (IL) 2083 Oak Creek (WI) 1667 333 Big Stone II Original (SD) 1680 100 Black & Veatch (2006) 1519 Council Bluffs (IA) 1504 Weston 4 (WI) 1500 EPA (2003) Generation Transmission 1467 Prairie State (IL) Total 1400 EPRI (2004) 1280 EIA (AEO 2006) 0 500 1,000 1,500 2,000 2,500 3,000 $/kW Pulverized coal capital costsvary greatly Notes: EIA, EPRI, EPA, and Black & Veatch estimates are overnight costs and don’t include interest during construction (IDC). It’s not clear whether the other estimates include IDC. Most of the estimates are in 2005$ and for a supercritical PC plant.
Wind costs have also increased…but are projected to fall again UCS class 4-6 No PTC, integration, or transmission costs are included Source: EIA, Annual Energy Outlook 2006, NREL Government Performance Review Act FY07, Black & Veatch data based on preliminary information developed for AWEA
Levelized Cost of Electricity (2010) vs. CO2 Price, 2010 120 110 Coal IGCC Coal PC 100 90 Coal IGCC w/CCS 2006$/MWh Gas CC 80 Nuclear 70 60 50 0 10 20 30 40 50 Carbon Price ($/ton CO2) CO2 costs make pulverizedcoal plants uneconomic • All costs are significantly higher than EIAs Source: Preliminary information developed by Black & Veatch for AWEA
Levelized Cost of Electricity (2010) vs. CO2 Price 120 Coal IGCC 110 Biomass IGCC w/CCS Coal PC 100 Wind Offshore 90 Coal IGCC w/CCS 2006$/MWh 80 Wind Class 4 70 Wind Class 6 60 50 0 10 20 30 40 50 Carbon Price ($/ton CO ) 2 CO2 prices make wind and biomass cheaper than coal PC and IGCC • No PTC, wind integration or transmission costs included • Biomass IGCC with CCS cheaper at ~$25/ton Source: Preliminary information developed by Black & Veatch for AWEA, except for Biomass IGCC w/CCS, which is based on data from IEA (2004) and Rhodes and Keith (2005), and assuming biomass fuel costs of $2.50/MMBtu
Conclusions • Future limits on global warming emissions are coming soon • These limits pose a major financial risk to utilities and ratepayers and will raise the cost of electricity from fossil fuels • Mandatory market based limits on CO2 with complementary policies for efficiency and renewables has lowest costs and greatest benefits • Utilities should factor CO2 into resource planning and procurement and aggressively pursue cleaner alternatives • Regulators should require utilities to takes these steps and shareholders not ratepayers to bear the risk • Shareholders and investors should recognize inevitability of CO2 regulations, require reporting and accountability, and invest in companies that are proactively managing these risks • Ratepayers and consumer groups should oppose efforts by utilities to recover CO2 costs in rates, oppose construction of new conventional coal plants, and support investments in cleaner alternatives