Download

1 / 37
370 likes | 564 Vues
ATM 521 Tropical Meteorology FALL 2009. ATM 521 Tropical Meteorology SPRING 2008. Instructor: Chris Thorncroft Room: ES226 Phone: 518 442 4555 E-mail: chris@atmos.albany.edu Aim of Course:

E N D
ATM 521 Tropical Meteorology SPRING 2008 Instructor: Chris Thorncroft Room: ES226 Phone: 518 442 4555 E-mail: chris@atmos.albany.edu Aim of Course: To describe and understand the nature of tropical weather systems and their role in the tropical climate, including emphasis on the interactions between dynamics and convection. Course Assessment: 1. Homework 15% 2. Class exam on Wednesday 14th October 30% 3. Final exam on Tuesday 15th Dec. 8.00-10.00am 55% Text Books: There is no recommended text book for this course.
ATM 521 Tropical Meteorology SPRING 2008 Lecture Plan: 1. Introduction 2. Tropical Convection (including MCSs) 3. Large-scale Tropical Circulations 4. Kelvin waves 5. Easterly waves 6. Tropical Cyclones Dry spells Flooding: Ghana 07 Flooding: New Orleans 05
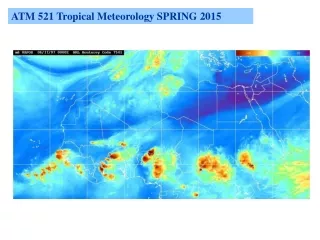
1. INTRODUCTION Where are the tropics and what makes them special? Zonal and time mean circulations Asymmetric circulations
2. TROPICAL CONVECTION Conditional Instability, CAPE, tephigrams Vertical profiles of conserved variables
MESOSCALE CONVECTIVE SYSTEMS Structure, propagation and longevity issues will be discussed as well as their impact on larger scales. See Houze, R. A., Jr., 2004: Mesocale convective systems Rev. Geophys., 42, 10.1029/2004RG000150, 43 pp.
Rainfall Stratiform Rain Fraction Percentage of MCSs with significant ice scattering Average Lightning flash density MESOSCALE CONVECTIVE SYSTEMS TRMM based MCS climatology over Africa and tropical Atlantic for June-July-August Schumacher and Houze (2006) QJRMS : Less stratiform rain over sub-Saharan Africa than Atlantic but, Stratiform rain increases in monsoon season compared to pre-monsoon season due to (i) reduced upper-level shear?, (ii) reduced impact of dry SAL?, (iii) other?
Heat Low SAL AEJ ITCZ 3 LARGE-SCALE TROPICAL CIRCULATIONS Key features of the West African Monsoon Climate System during Boreal summer Cold Tongue Observations and theory of monsoons Theories for large-scale motion Emphasis given to West African Monsoon
4. KELVIN WAVES L H H L cat3 convergence convection Solution of the shallow water model Kelvin waves are the dominant synoptic weather system in the equatorial Africa sector in Spring but they also exist in other basins (e.g. Pacific, Amazon). We will discuss their structure and theories for their existence and growth including how they interact with MCSs.
L H Evolution of Kelvin waveNegative phase • OLR (W/m2) • Shading: min convection • max convection • Wind at 850 hPa (m/s) • Vectors, significant at the T-test 99% level • Surface Pressure (Pa) • Contours dashed: low L • continue: high H
H L Evolution of Kelvin waveInitiation phase • OLR (W/m2) • Shading: min convection • max convection • Wind at 850 hPa (m/s) • Vectors, significant at the T-test 99% level • Surface Pressure (Pa) • Contours dashed: low L • continue: high H
L H Evolution of Kelvin waveActive phase • OLR (W/m2) • Shading: min convection • max convection • Wind at 850 hPa (m/s) • Vectors, significant at the T-test 99% level • Surface Pressure (Pa) • Contours dashed: low L • continue: high H
H Evolution of Kelvin wave Dissipation phase • OLR (W/m2) • Shading: min convection • max convection • Wind at 850 hPa (m/s) • Vectors, significant at the T-test 99% level • Surface Pressure (Pa) • Contours dashed: low L • continue: high H
MCSs embedded in Kelvin wave envelops Brightness Temperature (K) Resolution spatial : 0.5° temporal : 3 hours
5. EASTERLY WAVES Easterly waves are the dominant synoptic weather system in the Africa-Atlantic sector but they also exist in other basins (e.g. Pacific) We will discuss their structure and theories for their existence and growth including how they interact with MCSs (see next slides).
Diagnostics for highlighting multi-scale aspects of AEWs 315K Potential Vorticity (Coloured contours every 0.1PVU greater than 0.1 PVU) with 700hPa trough lines and easterly jet axes from the GFS analysis (1 degree resolution), overlaid on METEOSAT-7 IR imagery.
315K Potential Vorticity (Coloured contours every 0.1PVU greater than 0.1 PVU) with 700hPa trough lines and easterly jet axes from the GFS analysis (1 degree resolution), overlaid on METEOSAT-7 IR imagery.
315K Potential Vorticity (Coloured contours every 0.1PVU greater than 0.1 PVU) with 700hPa trough lines and easterly jet axes from the GFS analysis (1 degree resolution), overlaid on METEOSAT-7 IR imagery.
315K Potential Vorticity (Coloured contours every 0.1PVU greater than 0.1 PVU) with 700hPa trough lines and easterly jet axes from the GFS analysis (1 degree resolution), overlaid on METEOSAT-7 IR imagery.
315K Potential Vorticity (Coloured contours every 0.1PVU greater than 0.1 PVU) with 700hPa trough lines and easterly jet axes from the GFS analysis (1 degree resolution), overlaid on METEOSAT-7 IR imagery.
315K Potential Vorticity (Coloured contours every 0.1PVU greater than 0.1 PVU) with 700hPa trough lines and easterly jet axes from the GFS analysis (1 degree resolution), overlaid on METEOSAT-7 IR imagery.
315K Potential Vorticity (Coloured contours every 0.1PVU greater than 0.1 PVU) with 700hPa trough lines and easterly jet axes from the GFS analysis (1 degree resolution), overlaid on METEOSAT-7 IR imagery.
315K Potential Vorticity (Coloured contours every 0.1PVU greater than 0.1 PVU) with 700hPa trough lines and easterly jet axes from the GFS analysis (1 degree resolution), overlaid on METEOSAT-7 IR imagery.
315K Potential Vorticity (Coloured contours every 0.1PVU greater than 0.1 PVU) with 700hPa trough lines and easterly jet axes from the GFS analysis (1 degree resolution), overlaid on METEOSAT-7 IR imagery.
315K Potential Vorticity (Coloured contours every 0.1PVU greater than 0.1 PVU) with 700hPa trough lines and easterly jet axes from the GFS analysis (1 degree resolution), overlaid on METEOSAT-7 IR imagery.
315K Potential Vorticity (Coloured contours every 0.1PVU greater than 0.1 PVU) with 700hPa trough lines and easterly jet axes from the GFS analysis (1 degree resolution), overlaid on METEOSAT-7 IR imagery.
315K Potential Vorticity (Coloured contours every 0.1PVU greater than 0.1 PVU) with 700hPa trough lines and easterly jet axes from the GFS analysis (1 degree resolution), overlaid on METEOSAT-7 IR imagery.
315K Potential Vorticity (Coloured contours every 0.1PVU greater than 0.1 PVU) with 700hPa trough lines and easterly jet axes from the GFS analysis (1 degree resolution), overlaid on METEOSAT-7 IR imagery.
315K Potential Vorticity (Coloured contours every 0.1PVU greater than 0.1 PVU) with 700hPa trough lines and easterly jet axes from the GFS analysis (1 degree resolution), overlaid on METEOSAT-7 IR imagery.
315K Potential Vorticity (Coloured contours every 0.1PVU greater than 0.1 PVU) with 700hPa trough lines and easterly jet axes from the GFS analysis (1 degree resolution), overlaid on METEOSAT-7 IR imagery.
315K Potential Vorticity (Coloured contours every 0.1PVU greater than 0.1 PVU) with 700hPa trough lines and easterly jet axes from the GFS analysis (1 degree resolution), overlaid on METEOSAT-7 IR imagery.
315K Potential Vorticity (Coloured contours every 0.1PVU greater than 0.1 PVU) with 700hPa trough lines and easterly jet axes from the GFS analysis (1 degree resolution), overlaid on METEOSAT-7 IR imagery.
6. TROPICAL CYCLONES Observations and theory of tropical cyclones including issues that relate to genesis, structure and track
6. TROPICAL CYCLONES Key weather systems in the West African and Tropical Atlantic regions An ideal region to study scale interactions including how they impact downstream tropical cyclogenesis SAL AEWs TC MCSs
FINAL COMMENTS The course is fundamentally about the interactions between dynamics and convection, combining observations, modeling and theory. Ultimately a major motivation for research in this area is to improve our ability to predict tropical convection (over a range of space and timescales). This remains a major challenge and MUCH remains to be learned. The above is a major motivation for the proposed Year Of Tropical Convection (YOTC) a WCRP/THORPEX supported virtual field campaign that began during 2008. It is also a motivation for a joint AMMA-THORPEX Working Group that exists to evaluate and develop forecasting methods for the West African region. More information about both these activities will be provided during the course.
THE FINAL! • Exam will consist of 4-5 questions and will assume a knowledge of tropical convection. • Essay questions might be included. • Large-scale Tropics • Easterly waves • Kelvin waves • Tropical Cyclones