Download
1 / 36
360 likes | 456 Vues
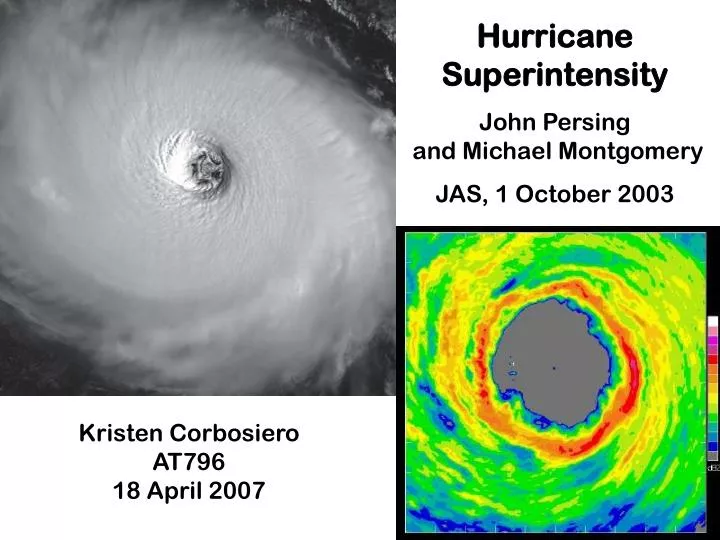
Hurricane Superintensity John Persing and Michael Montgomery JAS, 1 October 2003. Kristen Corbosiero AT796 18 April 2007. Outline 1. Superintense relative to what? MPI theories (Energetic & Thermodynamic) 2. Motivation for the current study

E N D
Hurricane Superintensity John Persing and Michael Montgomery JAS, 1 October 2003 Kristen CorbosieroAT79618 April 2007
Outline 1. Superintense relative to what? MPI theories (Energetic & Thermodynamic) 2. Motivation for the current study 3. Superintensity in the Rotunno-Emanuel model 4. The eye as a latent heat reservoir 5. Three-dimensional modeling and observational evidence for superintensity 6. Summary and conclusions
NHC Official Forecast track and intensity errors for the Atlantic Ocean Maximum Potential Intensity (MPI) theories were formulated to try to get a handle on what processes determine the upper bound on intensity http://www.nhc.noaa.gov/verification/
MPI Theory • Modern MPI theory led by Kerry Emanuel (1986, 1988, 1995, 1998) and Greg Holland (1997) • Both theories assume moist adiabatic ascent in the eyewall and are governed by SST, surface RH, and the thermal structure of the upper troposphere Figure 1, Camp and Montgomery (2001)
Holland MPI, T-MPI (T for thermodynamic), relies heavily on prescribed environmental and eye soundings, and convective instability (CAPE) that develops in the eyewall Emanuel MPI, E-MPI (E for energetic), relies on air-sea heat and momentum exchange (WISHE)
E-MPI is based on a balance between frictional dissipation and energy production in the inflowing boundary layer air, or a point balance between moist entropy and angular momentum Ψo∂χ/∂r2 = –Ck/Cd (1 + c|V|)|V|(χsea – χ) Entropy balance Ψo ∂R2/∂r2 = 2(1+c|V|)|V|rV Momentum balance Ψo = radial streamfunction (inflow)χ≡ (SST– Tout)(sinflow – senv)senv = cplnΘeCk, Cd = air-sea exchange coefficients for entropy and angular momentumc = empirical constantV = tangential wind speedR = angular momentum Entropy lost due to radial advection = Entropy gain from oceanMomentum gain from inflow = Momentum lost to ocean due to friction These two balance equations can be combined (with some fancy algebra) to get an equation for the maximum tangential wind of an axisymmetric, steady state vortex (Equations 2-5)
I K-R Current E-MPI maps from http://wxmaps.org/pix/hurpot.html
Most tropical cyclones do not reach their 2-D, symmetric, steady state derived E-MPI Among the factors neglected are vertical wind shear, convective asymmetries, secondary eyewalls, sea spray and wind-induced ocean cooling
Motivation • Hausman (2001) documented a systematic increase in intensity with increasing resolution using an axisymmetric hurricane model (Ooyama 2001) • The simulations converged at ~1 km resolution to an intensity of nearly 140 m s-1 which far exceeded the E-MPI • Based on this and other high resolution simulations that exhibited superintensity, Persing and Montgomery (2001) used the axisymmetric model of Rotunno and Emanuel (1987) to investigate the assumptions of E-MPI and document those assumptions that are violated in the simulations and that can explain superintensity
20-21 day average fields of the 4x resolution (3.75 km) run with the Rotunno Emanuel (1987) model This 2-D, non-hydrostatic model produces realistic hurricane structure
Time series of maximum Vt from the model (solid), E-MPI, (dotted) and simplified MPI from Equation 6 (dashed) The 2x, 4x and 8x runs all exceed their MPI around day 5 and reach an approximate steady state at day 10 The default run reaches steady state at its MPI around day 9, but then exceeds the MPI and reaches a new steady state by day 20
Vmax from E-MPI as a function of SST and Toutflow The boxes denote the range of E- MPI values in the simulations, while the stars are the actual superintense results
Vt = tangential wind (m s-1)RMW = radius of maximum wind (km)SLP = sea level pressure (hPa)W = updraft velocity (m s-1) Default = 15 km horizontal resolution
Convergence in intensity is reached by the 4x simulation, but not in updraft strength • Intensity changes can not be explained solely in terms of the shrinking of the RMW
Default run (15 km) temperature and potential temperature (Θ) anomalies This run had two steady states, one at its MPI (day 12, top) and one well above it (day 28, bottom) There is a substantial difference in eye structure between the two states
Equivalent potential temperature (Θe)for the default run The Θemaximum that develops by day 18 at 3 km inside the 20 km radius is a possible source of heat to eyewall convection if mixed outward(a violation of MPI theory!)
The reservoir of high Θe develops in two steps: • Elimination of the initial mid-level Θe minimum by convectively forced subsidence • Strong upward moisture flux under the eye
The 4x run (3.75 km)resolves the storm evolution in much greater detail including: 1) The concentration of strong subsidence just inside the eyewall 2) The large and deep 360+ KΘe reservoir in the eye 3) The eyewall updrafts are not moist neutral (violation!) Figure 17 of Rotunno and Emanuel (1987)
The ultimate source of high Θe in the 4x run (3.75 km) run is upward moisture flux from the ocean at significantly reduced surface pressures The heat flux is actually slightly negative in the eye due to subsidence warming Heat flux Moisture flux
4x run (3.75 km)half day trajectories in radius-height space There are 3 source regions for air entering the eyewall updraft: 1) From the eye (dotted) 2) From boundary layer (PBL) inflow (solid) 3) From low level inflow above the PBL (dashed)
4x run (3.75 km)half day trajectories in Θe-height space Downdraft air is indistinguishable from PBL inflow air by the time it reaches the eyewall Parcels with lower trajectories have the highest Θe Parcels increase their Θe as they rise in the eyewall above the PBL, requiring an additional source of heat other than the ocean…the eye!
The waviness of the trajectories in the eye and on the inner edge of the eyewall indicate parcels are detraining into the eye and being reintroduced to the eyewall frequently. Thus, 2 key assumptions of MPI theory have been violated: 1) Entropy exchange between the eye and eyewall is trivial2) The eyewall updraft is moist neutral
1.3 km resolution MM5 simulationHurricane Bob (1991) from Braun (2002) also shows the eye as a source of air for eyewall updrafts
4x run Θebefore and after addition of a heat sink in lower eye to mimic the elimination of the eye heat reservoir The storm weakened from 90 to 55 m s-1, but was still above its E-MPI
How does high Θe air from the eye produce a stronger storm? Secondary circulation from the model and calculated from Eliassen’s (1951) balanced vortex model using the model derived heat and momentum forcings The model is evolving largely in hydrostatic and gradient wind balance
How does high Θe air from the eye produce a stronger storm? • E-MPI theory assumes that all of the heat added to the eyewall is in the PBL from the ocean in a near perfect Carnot engine Isothermal compression Adiabaticexpansion Adiabaticcompression Isothermal expansion
How does high Θe air from the eye produce a stronger storm? • E-MPI theory assumes that all of the heat added to the eyewall is in the PBL from the ocean in a near perfect Carnot engine Cooling phase Cooling phase Warming phase
How does high Θe air from the eye produce a stronger storm? • Add eyewall to the warming phase and consider the warming of a parcel relative to the moist adiabat at the top and bottom of the eyewall Cooling phase Warming phase Adiabaticcompression Cooling phase Isothermal expansion Warming phase
How does high Θe air from the eye produce a stronger storm? • Persing and Montgomery suggests the following ad hoc modification of SST in E-MPI theory: • SST’ = SST + ΔΘe = SST + (Θe,out – Θe,sfc) • ΔΘe ≈ 8 K in the 4x simulation, increasing the SST from 26° to 34° C, increasing the MPI to ~80 m s-1 • This value is still slightly below the actual model intensity of 90 m s-1, but much greater than the E-MPI of 55 m s-1, and provides the largest increase in intensity of any of the assumptions tested
Evidence of superintensity (eye turbo-boost) in 3-D models Invertible moist potential vorticity (left) and Θe(right)from Braun (2002) Maximum Θe is located on the SE, outward advecting side of the cyclonic eyewall mesovortex (+)
5 km MM5 idealized TC simulation of Frank and Ritchie (2001) E-MPI would be ~65 m s-1
Dropsondes reveal low level eye Θe can be higher than in the eyewall Left: Hurricane Jimena Willoughby (1998) Below: Hurricane Isabel Aberson et al. (2006)
Dropsonde composites by LeeJoice (2000) found that in the 0-3 km layer, eye Θe was 5-10 K higher than the eyewall The eye has a significant vertical gradient of Θe, while the eyewall does not
Is most of the mixing accomplished by large mesovortices, small misovortices, instabilities or waves? Is mixing continuous or are there large, transient mixing events that temporally deplete the eye reservoir?
Θe (red) and 2-D streamlines (blue) overlaid with ql >.3 g kg-1 (light green) and ql>1 g kg-1 (dark green) in height-angular momentum space
Summary and Conclusions • At high spatial resolution, 2-D axisymmetric hurricane simulations produce steady state storms that greatly exceed their E-MPI • The cause of this superintensity was found to be the entrainment of high entropy air from the low level eye into the eyewall updraft • In the real world, in the face of the many negative influences on intensity (vertical wind shear, convective asymmetries, and ocean feedbacks), this additional source of heating may be important factor in TC intensity