H-R DIAGRAM
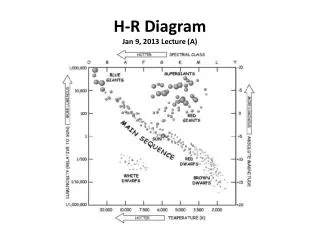
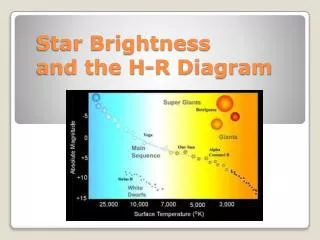
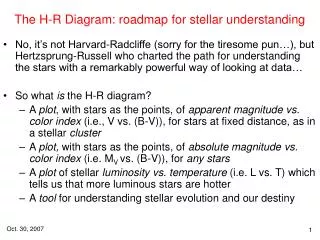
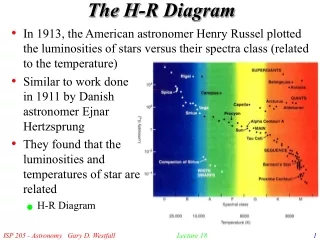
H-R DIAGRAM. HERTSPRUNG-RUSSELL DIAGRAM. The surface temperatures of main sequence stars range from about 3000 K (spectral class M) to over 30,000 K (spectral class O).

H-R DIAGRAM
E N D
Presentation Transcript
H-R DIAGRAM HERTSPRUNG-RUSSELL DIAGRAM
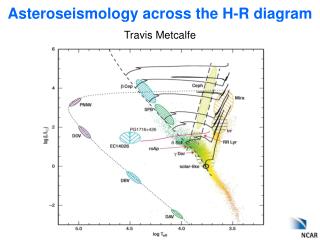
The surface temperatures of main sequence stars range from about 3000 K (spectral class M) to over 30,000 K (spectral class O). • This relatively small temperature range—only a factor of 10—is determined mainly by the rates at which nuclear reactions occur in stellar cores. • In contrast, the observed range in luminosities is very large, covering some eight orders of magnitude (that is, a factor of 100 million) and ranging from 10-4 to 104 times the luminosity of the Sun.
Astronomers can use the radius to luminosity to temperature relationship (L IS PROPORTIONAL TO Re2 X T e 4 ) to estimate the radii (R) of main-sequence stars from their temperatures (T) and luminosities (L). • They find that in order to account for the observed range in luminosities, stellar radii must also vary along the main sequence. • The faint, red M-type stars in the bottom right of the H—R diagram are only about 1/10 the size of the Sun, whereas the bright, blue O-type stars in the upper left are about 10 times larger.
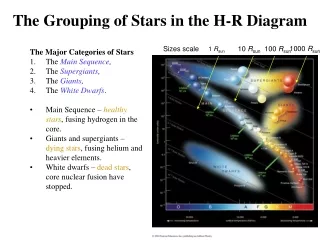
We see a very clear trend as we traverse the main sequence from top to bottom. • At one end, the stars are large, hot, and bright. Because of their size and color, they are referred to as blue giants. • At the other end, stars are small, cool, and faint. They are known as red dwarfs. Our Sun lies right in the middle.
WHITE DWARFS AND RED GIANTS • About 90 percent of all stars in our solar neighborhood, and probably a similar percentage elsewhere in the universe, are main-sequence stars. • About 9 percent of stars are white dwarfs • About 1 percent are red giants.
LUMINOSITY CLASS • The width of a spectral line can provide information on the density of the gas where the line formed. • The atmosphere of a red giant is much less dense than that of a main-sequence star, and this in turn is much less dense than the atmosphere of a white dwarf. • By studying the width of a star's spectral lines, astronomers can usually tell, with a high degree of confidence, whether or not it is on the main sequence.
Over the years, astronomers have developed a system for classifying stars according to the width of their spectral lines. • Because the line width is particularly sensitive to density in the stellar photosphere, and the atmospheric density in turn is well correlated with luminosity, the class in which a star is categorized has come to be known as its spectral class.
This classification provides a means for astronomers to distinguish supergiants from giants, giants from main-sequence stars, and main-sequence stars from white dwarfs by studying a single spectral property—the line broadening—of the radiation received.
CLASS DESCRIPTION • Ia Bright supergiants • Ib Supergiants • II Bright giants • III Giants • IV Subgiants • V Main-sequence stars/dwarfs
BINARY STARS • Most stars are members of multiple—star systems—groups of two or more stars in orbit around one another. • The majority of stars are found in binary clusters, which consist of two stars in orbit about their common center of mass, held together by their mutual gravitational attraction. • Most complex of all are the star clusters
VISUAL BINARIES have widely separated members that are bright enough to be observed and monitored separately • Spectroscopic binary A binary-star system which from Earth appears as a single star, but whose spectral lines show back-and-forth Doppler shifts as two stars orbit one another. • Recall that motion toward an observer blueshifts the lines, and motion away from the observer redshifts them.
In a double—line spectroscopic binary, two distinct sets of spectral lines—one for each component star—shift back and forth as the stars move. Because we see particular lines alternately approaching and receding, we know that the objects emitting the lines are in orbit. • In the more common single-line systems, one star is too faint for its spectrum to be distinguished, so only one set of lines is observed to shift back and forth.
In the much rarer , the orbital plane of the pair of stars is almost edge—on to our line of sight. In this situation, we observe a periodic decrease of starlight as one component passes in front of the other. By studying the variation of the light from the binary system—the binary's —astronomers can derive detailed information not only about the stars' orbits and masses but also about their radii.
optical doubles are just chance superpositions and carry no useful information about stellar properties.
Mass, more than any other stellar property, determines a star's position on the main sequence. Stars that form with low mass will be cool and faint; they lie at the bottom of the main sequence. Very massive stars are hot and bright; they lie at the top of the main sequence.
With few exceptions, main-sequence stars range in mass from about 0.1 to 20 the mass of the Sun. • The hot, O and B type, stars are generally about 10 to 20 times more massive than our Sun. • The coolest, K and M type stars, contain only a few tenths of a solar mass. • the mass of a star, at the time of formation, determines its location on the main sequence.
STELLAR LIFETIMES • We can estimate a star's lifetime simply by dividing the amount of fuel available (the mass of the star) by the rate at which the fuel is being consumed (the star's luminosity): • STELLAR LIFETIME IS PROPORTIONAL TO STELLAR MASS STELLAR LUMINOSITY cubed
Because the mass—luminosity relation tells us that a star's luminosity is roughly proportional to the cube of its mass, we can rewrite this expression to obtain, approximately, STELLAR LIFETIME IS PROPRTIONAL TO _______ 1________ STELLAR MASS squared
massive stars can survive only for short times. Their nuclear reactions proceed so rapidly that their fuel is quickly depleted despite their large masses. • We can be sure that all the O and B stars we now observe are quite young—less than a few tens of millions of years old. Massive stars older than that have already exhausted their fuel and no longer emit large amounts of energy. They have, in effect, died.
At the opposite end of the main sequence, the cooler K— and M—type stars have less mass than our Sun. With their low core densities and temperatures, their proton—proton reactions churn away rather sluggishly, much more slowly than those in the Sun's core. • Many of the K— and M—type stars now seen in the sky will shine on for at least another trillion years.
STAR CLUSTERS • If we observe a group of stars that all lie at the same distance from us, then comparing apparent brightnesses is equivalent to comparing absolute brightnesses. • Star clusters can include anywhere from a few dozen to a million stars in a region a few parsecs across • OPEN CLUSTERS - PLIEADES CLUSTER
GLOBULAR CLUSTERS • Globular clusters are much more tightly knit than the loose groups of stars that make up open clusters. All globular clusters are roughly spherical (which accounts for their name) and contain hundreds of thousands, and sometimes millions, of stars spread out over about 50 pc.
The distance to this cluster has been determined by a variation on the method of spectroscopic parallax but applied to the entire cluster rather than to individual stars. From calculations of the distance at which the apparent brightnesses of the cluster's stars taken as a whole best match theoretical models, the cluster is found to lie about 5000 pc from Earth.
We now know that, although low-mass red stars and intermediate-mass yellow stars abound, globular clusters contain no main-sequence stars with masses greater than about 0.8 the mass of the Sun. • Apparently, globular clusters formed long ago; the more massive O through F stars have long since exhausted their nuclear fuel and disappeared from the main sequence (becoming the red giants and other luminous stars above the main sequence
Other factors confirm that globular clusters are old. For example, their spectra show few heavy elements, implying that these stars formed in the distant past when heavy elements were much less abundant than they are today.
On the basis of these and other observations, astronomers estimate that all globular clusters are at least 10 billion years old. They contain the oldest known stars in the Milky Way Galaxy. As such, globular clusters are considered to be remnants of the earliest stages of our Galaxy's existence.