Stat 155, Section 2, Last Time
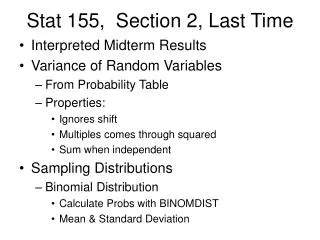
Stat 155, Section 2, Last Time. Interpreted Midterm Results Variance of Random Variables From Probability Table Properties: Ignores shift Multiples comes through squared Sum when independent Sampling Distributions Binomial Distribution Calculate Probs with BINOMDIST

Stat 155, Section 2, Last Time
E N D
Presentation Transcript
Stat 155, Section 2, Last Time • Interpreted Midterm Results • Variance of Random Variables • From Probability Table • Properties: • Ignores shift • Multiples comes through squared • Sum when independent • Sampling Distributions • Binomial Distribution • Calculate Probs with BINOMDIST • Mean & Standard Deviation
Reading In Textbook Approximate Reading for Today’s Material: Pages 334-351, 358-369 Approximate Reading for Next Class: Pages 382-396, 400-416
Binomial Distribution Normal Approximation to the Binomial Idea: Bi(n,p) prob. histo. curve So can approximate Binomial probs with normal areas
Normal Approx. to Binomial Before modern software, this was a critical issue, since Binomial Table (C in text) only goes to n = 20. Normal Approx made this possible… Now still useful, since BINONDIST conks out around n = 1000 (but political polls need n ~ 2000-3000).
Normal Approx. to Binomial Visualization of Normal Approximation: http://stat-or.unc.edu/webspace/postscript/marron/Teaching/stor155-2007/Stor155Eg20.xls Bi(100,0.3): Looks really good Bi(20,0.5): Chunky, approx. a little weak Bi(20,0.05): p too small for good approx. Bi(20,0.95): p too big for good approx.
Normal Approx. to Binomial When is Normal Approximation “acceptable”? Textbooks “Rule of Thumb” (there are others): Need: np >= 10 and n(1-p) >= 10 Relate to above examples: Bi(20,0.5): np = n(1-p) = 10, boundary case Bi(20,0.05): np = 4 < 10, poor approx. Bi(20,0.95): n(1-p) = 4 < 10, poor approx.
Normal Approx. to Binomial Nice Illustration: Publisher’s Website • Statistical Applets • Normal Approx to Binomial • Shows how rule of thumb makes sense
Normal Approx. to Binomial HW: 5.21 5.23
Normal Approx. to Binomial HW: C18: In a political poll of 2000, 1010 will vote for A. To decide how “safe” it is to predict A will win: • Calculate P{X >= 1010}, for X ~ Bi(2000,1/2) (0.327) (“could happen”, so not safe to predict) • Recalculate, assuming 1050 will vote for A (0.0127) (now have stronger evidence, will build on this)
Normal Approx. to Binomial A refinement: Continuity Correction Idea: • Binomial only takes on Integer Values • Not really Continuous • Better viewpoint (i.e. better approx.): Replace points by “± ½ bars”
Continuity Correction Graphically: Approx P{X=0} by areaof bar above (-0.5,0.5), under curve. I.e. P{X = 0} = P{-0.5<X<0.5}
Continuity Correction More examples: 3 4 5 6 7
Continuity Correction Next time, consider replacing above e.g by something with number lines….
Continuity Correction Excel example: http://stat-or.unc.edu/webspace/postscript/marron/Teaching/stor155-2007/Stor155Eg20.xls Part 3 For Bi(20,0.2): • Continuity Correction much better • About an order of magnitude in % error
Continuity Correction Notes: • Gives substantial improvement for small n • But doesn’t matter much for large n • Class rules: • do when easy • Skip when it adds complications…
Continuity Correction HW C 19: For X ~ Bi(25,0.4) • Check this is on the boundary of “OK” for using a Normal Approximation. Find: b. P{6 < X <= 11} • P{6 <= X < 11} Using:
Continuity Correction Using: • The naïve Normal approx. (0.607,0.607) • Normal approx. w/ cont. corr. (0.653,0.548) • The exact Binomial Distribution (0.659,0.556 )
Binomial Distribution Two Important “scales”: • Counts: X ~ Bi(n,p) (done above) • Proportions (~ percentages): , on [0,1] scale often very natural, e.g. political polls
Binomial for Proportions Relationship betweens means and SDs: (“on average, expect” )
Binomial for Proportions Normal Approx for Proportions: (just uses above means and SDs)
Binomial for Proportions HW: 5.25 work with both BINOMDIST and Normal Approx. (BINOMDIST: (a) 0.1495 (b) 0.0418)
And now for somethingcompletely different…. An interesting advertisement: http://www.albinoblacksheep.com/flash/honda.php
Section 5.2: Distrib’n of Sample Means Idea: Study Probability Structure of • Based on • Drawn independently • From same distribution, • Having Expected Value: • And Standard Deviation:
Expected Value of Sample Mean How does relate to ? Sample mean “has the same mean” as the original data.
Variance of Sample Mean Study “spread” (i.e. quantify variation) of Variance of Sample mean “reduced by ”
S. D. of Sample Mean Since Standard Deviation is square root of Variance, Take square roots to get: S. D. of Sample mean “reduced by ”
Mean & S. D. of Sample Mean Summary: Averaging: • Gives same centerpoint • Reduces variation by factor of Called “Law of Averages, Part I”
Law of Averages, Part I Some consequences (worth noting): • To “double accuracy”, need 4 times as much data. • For “10 times the accuracy”, need 100 times as much data.
Law of Averages, Part I Nice Illustration: Publisher’s Website • Statistical Applets • Law of Large Numbers
Law of Averages, Part I HW: 5.29
Distribution of Sample Mean Now know center and spread, what about “shape of distribution”? Case 1: If are indep. CAN SHOW: (knew these, news is “mound shape”) Thus work with NORMDIST & NORMINV
Distribution of Sample Mean Case 2: If are “almost anything” STILL HAVE: “approximately”
Distribution of Sample Mean Remarks: • Mathematics: in terms of • Called “Law of Averages, Part II” • Also called “Central Limit Theorem” • Gives sense in which Normal Distribution is in the center • Hence name “Normal” (ostentatious?)
Law of Averages, Part II More Remarks: • Thus we will work with NORMDIST & NORMINV a lot, for averages • This is why Normal Dist’n is good model for many different populations (any sum of small indep. Random pieces) • Also explains Normal Approximation to the Binomial
Normal Approx. to Binomial Explained by Law of Averages. II, since: For X ~ Binomial (n,p) Can represent X as: Where: Thus X is an average (rescaled sum), so Law of Averages gives Normal Dist’n
Law of Averages, Part II Nice Java Demo: http://www.amstat.org/publications/jse/v6n3/applets/CLT.html 1 Dice (think n = 1): Average Dist’n is flat 2 Dice (n = 1): Average Dist’n is triangle … 5 Dice (n = 5): Looks quite “mound shaped”
Law of Averages, Part II Another cool one: http://www.ruf.rice.edu/~lane/stat_sim/sampling_dist/index.html • Create U shaped distribut’n with mouse • Simul. samples of size 2: non-Normal • Size n = 5: more normal • Size n = 10 or 25: mound shaped
Law of Averages, Part II Textbook version: Publisher’s Website • Statistical Applets • Central Limit Theorem
Law of Averages, Part II Class Example: http://stat-or.unc.edu/webspace/postscript/marron/Teaching/stor155-2007/Stor155Eg21.xls Shows: • Even starting from non-normal shape, • Averages become normal • More so for more averaging • SD smaller with more averaging ( )
Law of Averages, Part II HW: 5.35, 5.37, 5.39, 5.45
And now for somethingcompletely different…. A statistics professor was describing sampling theory to his class, explaining how a sample can be studied and used to generalize to a population. One of the students in the back of the room kept shaking his head.
And now for somethingcompletely different…. "What's the matter?" asked the professor. "I don't believe it," said the student, "why not study the whole population in the first place?" The professor continued explaining the ideas of random and representative samples. The student still shook his head.
And now for somethingcompletely different…. The professor launched into the mechanics of proportional stratified samples, randomized cluster sampling, the standard error of the mean, and the central limit theorem. The student remained unconvinced saying, "Too much theory, too risky, I couldn't trust just a few numbers in place of ALL of them."
And now for somethingcompletely different…. Attempting a more practical example, the professor then explained the scientific rigor and meticulous sample selection of the Nielsen television ratings which are used to determine how multiple millions of advertising dollars are spent. The student remained unimpressed saying, "You mean that just a sample of a few thousand can tell us exactly what over 250 MILLION people are doing?"
And now for somethingcompletely different…. Finally, the professor, somewhat disgruntled with the skepticism, replied, "Well, the next time you go to the campus clinic and they want to do a blood test...tell them that's not good enough ... tell them to TAKE IT ALL!!" From: GARY C. RAMSEYER • http://www.ilstu.edu/~gcramsey/Gallery.html