Download
1 / 52
540 likes | 1.36k Vues
Revenues, Sales Variances, and Customer-Profitability Analysis. Chapter 16. Introduction. Companies that prosper make revenue planning and revenue analysis top priorities for their managers. This chapter examines revenue allocation issues and sales variances.

E N D
Revenues, Sales Variances, and Customer-Profitability Analysis Chapter 16
Introduction • Companies that prosper make revenue planning and revenue analysis top priorities for their managers. • This chapter examines revenue allocation issues and sales variances. • It also explores topics related to customer revenues and customer costs.
Learning Objective 2 Allocate the revenues of a bundled package to the individual products in that package
Revenue Allocation Methods • Sedona Languages Institute buys English language software programs locally and then sells them in Mexico and Central America. • Sedona sells the following programs: Grammar, Translation, and Composition • These programs are offered stand-alone or in a bundle.
Revenue Allocation Methods • Stand-alone Price Grammar $255 Translation $ 85 Composition $185 • Purchasing these software programs cost Sedona the following: Grammar $180 Translation $ 45 Composition $ 95
Revenue Allocation Methods Bundle (Suites) Price Grammar + Translation $290 Grammar + Composition $350 Grammar + Translation + Composition $410
Revenues and Bundled Products • What businesses provides bundled products? • Banks provide: • Checking • Safety deposit boxes • Investment advisory
Revenues and Bundled Products • Hotels provide: • Lodging • Food and beverage services • Recreational activities • Tours provide: • Transportation • Lodging • Guides
Revenue Allocation Methods • The two main revenue allocation methods are: • The stand-alone method • The incremental method
Stand-Alone Revenue Allocation Method • The stand-alone revenue allocation method uses product-specific information on the bundle of products as the weights to allocate the bundled revenues to the individual products. • The term “stand-alone” refers to the product as a separate (non-suite) item.
Stand-Alone Revenue Allocation Method • There are four types of weights for the stand-alone revenue allocation method. • Selling prices • Unit costs • Physical units • Stand-alone product revenues
Stand-Alone Revenue Allocation Method • Consider the Grammar and Translation suite, which sells for $290 per day. • How much weight should Sedona Languages Institute assign to each item?
Stand-Alone Revenue Allocation Method Selling prices: The individual selling prices are $255 for Grammar and $85 for Translation. Grammar: $255 ÷ $340 = 0.75 0.75 × $290 = $217.50 Translation: $85 ÷ $340 = 0.25 0.25 × $290 = $72.50
Stand-Alone Revenue Allocation Method • Unit costs: This method uses the costs of the individual products to determine the weights for the revenue allocations. • Grammar: $180 ÷ $225 = 0.80 0.80 × $290 = $232 Translation: $45 ÷ $225 = 0.20 0.20 × $290 = $58
Stand-Alone Revenue Allocation Method • Physical units: This method gives each product unit in the suite the same weight when allocating suite revenue to individual products. • With two products in the suite, each product is allocated 50% of suite revenues. 1 ÷ (1 + 1) = 0.50 0.50 × $290 = $145
Stand-Alone Revenue Allocation Method • Stand-alone product revenues: This method captures the quantity of each product sold as well as their selling prices. • Assume that the stand-alone revenues in 2001 are Grammar $734,400, Translation $81,600, and Composition $133,200. • What are the weights for the Grammar and Translation suite?
Stand-Alone Revenue Allocation Method Grammar: $734,400/$816,000 = 0.90 0.90 × $290 = $261 Translation: $81,600/$816,000 = 0.10 0.10 × $290 = $29
Stand-Alone Revenue Allocation Method Revenue Allocation Weights Grammar Translation Selling prices $217.50 $ 72.50 Unit costs 232.00 58.00 Physical units 145.00 145.00 Stand-alone product revenues 261.00 29.00
Stand-Alone Revenue Allocation Method • The selling price and stand-alone product revenue weights have the advantage that they frequently are a good indicator of the minimum benefits customers receive from those products.
Incremental Revenue Allocation Method • The incremental revenue allocation method ranks the individual products in a bundle according to criteria determined by management. • This ranking is used to allocate the bundled revenues to the individual products.
Incremental Revenue Allocation Method • The first-ranked product is termed the primary product in the bundle. • The second-ranked product is termed the first incremental product. • The third-ranked product in the second incremental product, and so on.
Incremental Revenue Allocation Method • Assume that Grammar is designated as the primary product. • If the suite selling price exceeds the stand-alone price of the primary product, the primary product is allocated 100% of its stand-alone revenue.
Incremental Revenue Allocation Method Revenue Remaining to be Revenue Allocated to Product AllocatedOther Products Grammar $255 $35 ($290 – $255) Translation 35 -0- Total revenue allocated $290
Learning Objective 3 Provide additional information about the sales-volume variance by calculating the sales-mix and sales-quantity variances
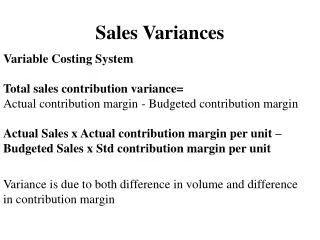
Sales-Volume Variance Components • The following information relates to Sedona Languages Institutebudgetfor the year 2001. • Product GrammarTrans.Comp. Selling price per unit $259 $87 $185 Variable cost 18950 95 Contribution margin per unit $ 70 $37 $ 90
Sales-Volume Variance Components ProductGrammarTrans.Comp. Contr. margin 70 37 90 × No. of units 3,185 980 735 = Total $222,950 $36,260 $66,150 Sales mix based on units 65% 20% 15% Total budgetedcontribution margin = $325,360
Sales-Volume Variance Components • The following are the actual results for Sedona Languages for the year 2001. • ProductGrammarTrans.Comp. Selling price/unit $255 $85 $185 Variable cost 180 45 95 Contribution margin per unit $ 75 $40 $ 90
Sales-Volume Variance Components ProductGrammarTrans.Comp. Contr. margin 75 40 90 × No. of units 2,880 990 630 = Total $216,000 $39,600 $56,700 Sales mix based on units 64% 22% 14% Total actual contribution margin = $312,300
Market-Share Variance • Assume that Sedona Languages Institute derives its total unit sales budget for 2001 from a management estimate of a 20% market share and a total industry sales forecast by Desert Services of 24,500 units in the region. • In 2001, Desert Services reported actual industry sales of 28,125 units.
Market-Share Variance • What is Sedona’s actual market share? • 4,500 ÷ 28,125 = 0.16 • Budgeted total contribution margin is $325,360. • Budgeted number of units is 4,900. • What is the budgeted average contribution margin per unit? • $325,360 ÷ 4,900 = $66.40
Summary of Variances Static-Budget Variance 13,060 U Level 1 Flexible-Budget Variance $17,370 F Sales-Volume Variance $30,430 U Level 2
Summary of Variances Sales-Volume Variance $30,430 U Level 2 Sales-Mix Variance $3,870 U Sales-Quantity Variance $26,560 U Level 3
Summary of Variances Sales-Quantity Variance $26,560 U Level 3 Market-Share Variance $74,700 U Market-Size Variance $48,140 F Level 4
Learning Objective 6 Discuss why revenues can differ across customers purchasing the same product
Customer Revenues and Customer Costs • An analysis of customer differences on both revenues and costs can provide important insight into why differences in customer profitability exists.
Customer Revenue Analysis • During the first six months of 2002, Sedona Languages Institute expanded its market and sold 200 composition programs to two new customers in Colombia. • Customer A is in Bogota and customer B is in Barranquilla.
Customer Revenue Analysis • Customer A B Programs sold 140 60 List selling price $185 $185 Invoice price $175 $180 Total revenues $24,500 $10,800 • What explanation(s) can be given for these revenue differences?
Customer Revenue Analysis • Two variables explain revenue differences between these two customers: • The volume of programs purchased • The magnitude of price discounting • Price discounting is the reduction of selling prices below listed levels in order to encourage increases in customer purchases.
Customer Cost Analysis • Assume that Sedona Languages Institute has an activity-based costing system that focuses on customers rather than products. • Activity Area Cost Driver and Rate Order taking $ 80 per purchase order Set-up $100 per batch
Customer Cost Analysis • Customer AB Number of: Purchase orders 7 2 Batches 7 2 • What is the cost of servicing each customer?
Customer Cost Analysis • Customer A: Ordering: 7 × $80/order = $ 560 Set-up : 7 × $100/batch = 700 Total $1,260 • Sedona can use this information to persuade this customer to reduce usage of the ordering and set-up cost drivers.
Customer Cost Analysis Customer B: Ordering: 2 × $80/order = $160 Set-up: 2 × $100/batch = 200 Total $360
Learning Objective 7 Prepare a customer-profitability report
Customer-Profitability Profiles • Managers find customer profitability analysis useful for several reasons: • It highlights how vital a small set of customers is to total profitability. • When a customer is ranked in the “marginal” category, managers can focus on ways to make future business with this customer more profitable.
Customer-Profitability Profiles • Which customer is more profitable, A or B? • AB Revenues $24,500 $10,800 Cost of good sold ($95 per unit) 13,300 5,700 Contribution margin 11,200 5,100 Other expenses 1,260 360 Operating income $ 9,940 $ 4,740
Customer-Profitability Profiles • Customer A seems to be more profitable. • However, customer B has a higher gross profit percentage. • Customer A has a gross profit of 40.6% ($9,940 ÷ $24,500). • Customer B has a gross profit of 43.9% ($4,740 ÷ $10,800).
Customer-Profitability Profiles • Customer profitability reports often highlight that a small percentage of customers contribute a large percentage of operating income. • It is important that companies devote sufficient resources to maintaining and expanding relationships with these key contributors to profitability.
Learning Objective 8 Apply the concept of cost hierarchy to customer costing
Cost Hierarchy • Customer cost hierarchies are being used by companies such as General Motors to highlight how some costs can be reliably assigned to individual customers while other costs can be reliably assigned only to distribution channels or to corporate- wide efforts.
Cost Hierarchy • General Motors uses a seven level cost hierarchy to analyze profitability. • The aim of this cost hierarchy is to assign costs to the lowest level of the hierarchy at which they can be identified.