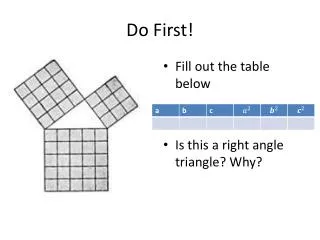
DO FIRST
Explore different research methods in psychology and why they are essential. Learn about naturalistic observation, case studies, surveys, testing methods, laboratory studies, correlation analyses, and experimental methods. Uncover how correlation coefficients and scatterplots help predict outcomes.

DO FIRST
E N D
Presentation Transcript
DO FIRST • Pick up handouts • Place your psychology journal and rubber-banded flashcards in the polkadot box • Fill out the half-sheet you received when you entered and be ready to discuss
Creating New Knowledge Research Methods and Statistics
Why is this important? • AP Free Response • Psychology is a science • Power Balance
naturalistic observation • observing behavior in the natural environment, without disruption • being an “unobtrusive observer”
case study • carefully drawn biography of a person or group, gathered over a long period of time
survey method • surveys or questionnaires developed to obtain information from a large number of people in efficient, cost-effective ways
testing method • acquiring data from large groups of people through testing. Valid Reliable
laboratory method • study done in a carefully controlled laboratory environment, without the hypothesis that an experiment has
correlation method • shows relationships between two things. • correlation only shows relationship, not causation.
experimental method • the only method that can determine cause and effect. • why? because the experimenter has complete control.
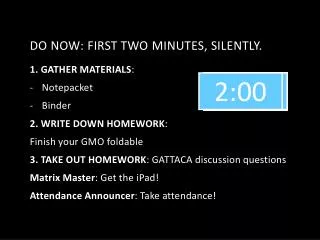
DO FIRST • Have out: • Any flashcards you’ve made or reading notes you’ve taken for Chapter 2. • Your homework from the weekend. • One black pen and one red pen. • Your time for the reading quiz will begin counting down as soon as the bell rings. • Reminder: • Tomorrow afternoon in the art room, we will go over the Unit 1 test. We will spend time going over the questions that most people missed, and answering any other questions you have. To be eligible to retest, you must come to this tutorial. • The daily objectives are on your unit calendar. Familiar yourself with what you will be responsible for learning today!
Correlation nation Thinking critically about relationships
Consider this… • People who ate Frosted Flakes as children have half the cancer rate of those who never ate cereal… • There is a negative correlation between Frosted Flakes for breakfast and cancer rates • People who’ve had routine physicals in the previous 3 years are twice as likely to report high blood pressure and cholesterol levels… • There is a positive correlation between routine physicals and high blood pressure/cholesterol • In Houston, as ice cream consumption increases, the crime rate increases… • There is a positive correlation between ice cream eating and crime rates • What is going on?!
Correlation coefficient • The measurement of relationship between two values. • A NUMBER between -1.00 and +1.00 that shows (denoted by a little r) • 1. Strength of relationship • 2. Direction of relationship
Correlation coefficient • The correlation coefficient between ice cream consumption and crime rate is 0.87. • How strongis the relationship? • What direction is the relationship?
Correlation coefficient • The correlation coefficient between ice cream consumption and crime rate is r = 0.87. • How strongis the relationship? • What direction is the relationship?
Correlation coefficient • The correlation coefficient between eating Frosted Flakes for breakfast and having cancer is r = -0.63. • How strongis the relationship? • What direction is the relationship?
Correlation coefficient • The correlation coefficient between having your ears pierced and getting good grades is r = 0.0 • How strongis the relationship? • What direction is the relationship?
Correlation coefficient • A scientific study measuring the relationship between eating breakfast and focusing in class found that there was a very strong positive correlation. Which of the following correlation coefficients most likely represents their findings? • A. -1.00 • B. -0.87 • C. 0.35 • D. 0.63 • E. 1.14
Scatterplots • What does a positive scatterplot look like? • What does a negative scatterplot look like? • What does an uncorrelated scatterplot look like?
Predicting outcomes • We already know that correlation does not prove causation. However, correlation can help us predict certain outcomes. How can we use a correlation coefficient to predict outcomes?
DO FIRST • Answer the following question at the top of your notes for today: • We already know that correlation does not prove causation. However, correlation can help us predict certain outcomes. How can we use a correlation coefficient to predict outcomes? • For example, if we know that the correlation coefficient between reading 5 or more books a month and higher GPAs is 0.78, what can we predict about a student who reads 7 books a month? A student who has a 3.78 GPA? • If we know that the correlation coefficient between drinking green tea and not having cancer rates is -0.12, what can we predict about someone who drinks a lot of green tea? About someone who doesn’t have cancer?
Experimental method!!! Determining Cause and Effect
Hypothesis • If students drink Red Bull, then they will be hyperactive.
Hypothesis • If students drink Red Bull, then they will be hyperactive.
INDEPENDENT vs. Dependent Variables • Independent variable—what the scientist manipulates • Dependent variable—what the scientist measures
Hypothesis • If students drink Red Bull, then they will be hyperactive. dependent independent
Operational Definitions • An explanation that sets limits around a term or concept for the purpose of a specific experiment or piece of research. • FACILITATES REPLICATION! • What do we need to define? • Children: • Hyperactive: • Red Bull:
Hypothesis • If students drink Red Bullcaffeine, then they will be hyperactive.
Controls • Making sure that outside influences won’t confound your results. • What are some things that could confound our results? • Breakfast? • Caffeine consumption?
DO FIRST • Arrange yourself into a living frequency distribution, using the red number. Determine who is the mean, median, and mode—By the time the bell rings, the mean should be doing jumping jacks, the median should be sitting on the floor, and the mode should be turning in circles.
DO Next • Now, arrange your numbers into a frequency histogram on the wall.
DO Next • Now, arrange your numbers into a frequency histogram on the wall.
DO FIRST • Get out your homework and share with your table your thoughts on the two experiments you read about
DO FIRST • Get out your homework and share with your table your thoughts on the two experiments you read about
Ethical Guidelines of Research • People first, research second • Informed consent • Deception must be justified • Option to withdraw • Protection from risk • Debrief • Confidentiality
What about animals? • Research that is difficult or dangerous to answer with humans • Easier to control • Shorter lives—long-term effects easier to study