Download
1 / 47
470 likes | 492 Vues
Learn about tropical cyclone categories, accumulated cyclone energy, and implications for elevated terrain. Explore the impact of climate on cyclone activity and the potential risks for high-rise structures. Discover the reasons behind increased cyclone activity in the Atlantic region and the ongoing debate on the role of anthropogenic global warming versus natural variability.

E N D
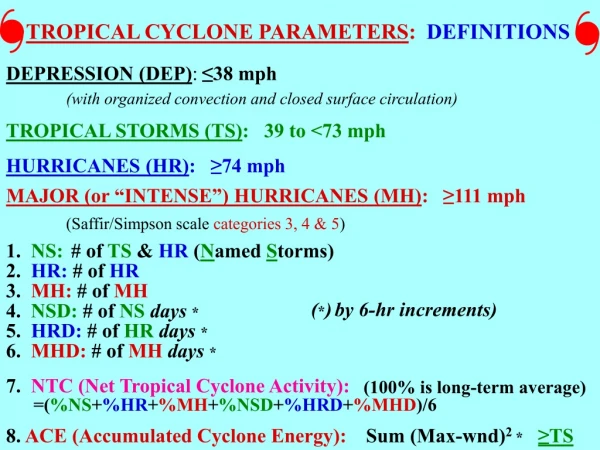
TROPICAL CYCLONE PARAMETERS: DEFINITIONS DEPRESSION (DEP):≤38 mph (with organized convection and closed surface circulation) TROPICAL STORMS (TS):39 to <73 mph HURRICANES (HR):≥74 mph MAJOR (or “INTENSE”) HURRICANES (MH):≥111 mph (Saffir/Simpson scale categories 3, 4 & 5) 1. NS: # of TS & HR (Named Storms) 2. HR: # of HR 3. MH: # of MH (*)by 6-hr increments) 4. NSD: # of NSdays* 5. HRD: # of HRdays* 6. MHD: # of MHdays* 7. NTC (Net Tropical Cyclone Activity): (100% is long-term average) =(%NS+%HR+%MH+%NSD+%HRD+%MHD)/6 8.ACE (Accumulated Cyclone Energy): Sum (Max-wnd)2 * ≥TS
The Force of the wind is proportional to the square of its speed: Fµ V2
Sluice GateMain Development Region (MDR) NTC = 32% EL NIÑO 4 5 4 0 1983 3 5 3 0 2 5 2 0 N O A C T I V I T Y I N T R O P I C S 1 5 1 0 TS HR (Cat 1-2) 5 MH (Cat 3-5) 0 - 1 0 0 - 9 0 - 8 0 - 7 0 - 6 0 - 5 0 - 4 0 - 3 0 - 2 0 NTC = 229% L A N I Ñ A 4 5 4 0 1995 1969 3 5 3 0 2 5 2 0 1 5 1 0 TS HR (Cat 1-2) 5 MH (Cat 3-5) 0 - 1 0 0 - 9 0 - 8 0 - 7 0 - 6 0 - 5 0 - 4 0 - 3 0 - 2 0
UPPER-LEVEL WINDS LOWER-LEVEL WINDS Effects of Vertical Wind Shear (Vz) on Tropical Cyclones STRONG SHEAR = UNFAVORABLE WEAK SHEAR = FAVORABLE
MJO (Madden-Julian Oscillation) 30-60 days, can result in:
‘05 * Net Tropical Cyclone Activity (NTC)1950-2005 ‘04 * ‘03 * 2002 2004
Atlantic Major Hurricanes1950-2005 * * 2002 2004
Thermohaline Circulation (Ocean Conveyor Belt)“Salt Oscillator” • Stronger is favorable for N. Atl. TCs (Warm N.Atl) • Weaker is unfavorable for N. Atl. TCs (Cool N.Atl)
% Coverage of Favorable (< 6 m/s) Vertical Shear (S. Central MDR: 20°-70°W, 10°-14°N) WEAK SHEAR STRONG SHEAR
Implications of Multidecadal-scale Increase In Atlantic Basin Major Hurricane Activity + Dramatic increases in population during the 25 year lull = Potential for massive damage (especially when major cities are impacted) and large loss of life (especially rapid intensification, evacuation foul ups and rainfall-induced flash flooding) Major Hurricanes account for most damage and fatalities
IMPLICATIONS FOR ELEVATED TERRAIN AND HIGH-RISES WINDS AT THE TOP OF A 30-STORY BUILDING WILL AVERAGE 20 KT (1 SSHS CAT) HIGHER THAN AT THE SURFACE.
Warmer Atlantic Cooler Atlantic E. Coast Major Hurricanes (Cat. 3-4-5)
Cooler Atlantic Warmer Atlantic Caribbean Hurricanes(Cat. 1,2 and Cat. 3-4-5)
Summary of main increases since 1995 • Overall activity (NTC): 2X • Number of Major Hurricanes: 2.5X (Not stronger storms , but more of the stronger storms) • Caribbean hurricanes: 5X !! • October/November Major hurricanes: ~10X !! (up from once every 10 years to almost once per year)
Why is current active era "more" active than previous active era? ‘05 * Net Tropical Cyclone Activity (NTC)1950-2005 ‘04 * ‘03 * 2002 2004
Is the increased activity fromAGW (Anthropogenic Global Warming) or Natural Variability or both?
Causes for Recent AGW Controversy(Anthropogenic Global Warming) • Not just increased activity since 1995, but INCREASED U.S. LANDFALLS since 2004 • Tendency of some in media, gvt. & certain scientific circles to attribute almost ANY increase in natural disasters to AGW. “If it’s bad -- it must be AGW!” • Push by a few scientists (began 2004) to announce that the horrible landfalls were from AGW! • Two articles -- in journals of Nature & Sciencethat attributed so-called trends in activity to AGW • Extensive publicity that followed those articles
Some Problems with Recent GW/Hurricane Findings-1 • Just because it is published in the refereed scientific literature doesn’t make it true! (Even Science or Nature) • For the one of the recent studies -- there are already two “Comments” published challenging it and there are two “Comments” possibly being published against the other one as well. • There are numerous other published articles that support the finding that the vast majority of the increase is from natural variability. • Increased SSTs don’t automatically mean more hurricanes (esp. more MHs) --- it takes changes in atmospheric circulation as well (e.g., lower Vertical Shear).
Some Problems with Recent GW/Hurricane Findings -2 • Most of the top experts in the historical hurricane data feel the data do not support the AGW findings! • The Science study (Global Hurricanes -- 1970-2004): Used the least reliable type of data (#’s of Cat 4+5) Started sample at low pt. in activity for NATL/WPAC • Nature study (North Atlantic Hurricanes): Didn’t filter end-pts. properly Artificially suppressed previous active era. • Observational/reporting methodologies have changed greatly decade by decadeRecon, satellite, Dvorak technique, GPS dropsondes, etc. E.g., East Pacific -- taken over by NHC in 1988 • Basins don’t normally re-analyze previous years • We need a global reanalysis of data base (e.g. NATL)
Webster et al.[Science (9/2005)]Global # of Category 4+5 TC’s => nearly 2X in past 35 years.” • Problems with the study: • Started in 1970 to use Satellite data but availability, quality & application of data have evolved greatly. • Dvorak IR technique only used globally since late 80’s • Ignored natural variability -- • NATL & WPAC higher <1970 • Large changes in EPAC when NHC took over responsibility in 1988 • 70-87 => 2 >125 kts • 88-05 => 20 >125 kts • NIO Cat 4+5: 1 (75-89), 7 (90-04) SUMMER SST
Problems with East Pacific Basin (EPAC) • Note -- Webster et al. actually included part the Gulf of Mexico! (Also, all of his basins only went to 20°N/S.) • EPAC TCs handled by Redwood City, WSFO till 1987, when taken over by NHC. • 1970-1987, they reported only 2 TCs > 125 kts. • 1988-2005, NHC reported 20 TCs > 125 kts. • For all Cat 4+5 EPAC TCs • 1970-1987 => 38 • 1988-2005 => 55 (More than a 50% increase) • Comparing last two 10-year period (from Gray) • 1985-94 => 31; 1995-2004 => 30 -- Almost NO difference! • Note that EPAC is usually MUCH more active when NATL has a slow year. 1970-1987 was an EXTREMELY slow period for NATL! Therefore -- the biases here are even worse than they look!
NHC=> Problems with East Pacific Basin (EPAC) (cont.) EPAC TC Max Winds 1949-1996 Years for Webster et al. • Prior to ~1970, almost all EPAC TCs were ranked as 40 kts. (TS) or 75 kts. (Cat 1 Hurricane)!!
Ending of Science Article (Goldenberg et al. 2001) • Tropical North Atlantic SST has exhibited a warming trend of ~0.3°C over the last 100 years; whereas Atlantic hurricane activity has not exhibited trend-like variability, but rather distinct multidecadal cycles as documented here and elsewhere… • The possibility exists that the unprecedented activity since 1995 is the result of a combination of the multidecadal-scale changes in Atlantic SSTs (and vertical shear) along with the additional increase in SSTs resulting from the long-term warming trend. • It is, however, equally possible that the current active period (1995-2000) only appears more active than the previous active period (1926-70) due to the better observational network now in place. During the previous active period, only 1966-70 had continual satellite coverage. Further study is essential to separate any actual increase from an apparent one due to more complete observations.
Global Warming and Hurricane Winds: Theory and Modeling Work Suggest Perhaps ~1% Increase Today 1-2 mph of Katrina’s 170 mph
Global Warming versus Society Changes: Hurricane Damages Society Changes Climate Constant % INCREASE IN LOSSES 2000-2050 Climate Changes Society Constant
SEASONAL FORECASTING: REALITY CHECK • CLIMATE is what we expect -WEATHER is what we get! (Robert Heinlein) • There is no current seasonal hurricane forecast (nor do I think there ever will be) that can predict with any sufficient degree of certainty that a particular (vulnerable) locality or even a particular region will or will not be affected by a tropical cyclone disaster in a particular year! • Therefore, adequate preparedness measures must be implemented every year!
11 tropical storms, 8 hurricanes and 5 major hurricanes affected Florida during the past 2 years.
By contrast, during the preceding 53-year period, Florida had five major hurricane landfalls!
HURRICANES HAPPEN! Hurricanes Happen! “Hope for the best; Prepare for the worst!” (Old Russian proverb)
Hurricanes Happen! “Maximize your preparations to minimize your impact!” Mike Ronan (RCCL) or Rick Strunck (NCL/OL)
The 5 P's of Preparedness The 5 P’s of Preparedness • Protection • Provisions • Plans • Predictions • Pray!
Monolithic Dome Home, Pensacola Beach, FL Survived Direct Hit by Hurricane Ivan(2004)from Sun Sentinel (11/14/04)
Monolithic Dome (Upper Room Assembly -- Miami, FL) www.upperroomassembly.com 4/06 Cutler Ridge
How does it matter to YOU? (AGW vs. NV) • What would you do differently? • Most focus needs to be on preparedness! E.g., If a tsunami is coming – quit arguing about why or why there weren’t better warnings – take shelter! • Does it matter if forecast (and season) isis above average or not? Only ONE difference -- busy year can have multiple hits.
"Therefore whoever heareth these sayings of mine and doeth them, I will liken him unto a wise man, which built his house upon a rock; A word to the wise…. And the rain descended, and the floods came, and the winds blewupon that house; and it fell not: for it was founded upon a rock. And every one that heareth these sayings of mine, and doeth themnot, shall be likened unto a foolish man,which built his house upon the sand: (Matthew 7:24-27) KJV And the rain descended, and the floods came, and the winds blew,and beat upon that house; and it fell: and great was the fall of it !"
Winds -- Distribution & Gusts • Maximum sustained (surface) winds --Usually strongest to RIGHT of direction storm is moving, and the weakest to the left.Very few people actually get the worst winds (so in a Cat 3 storm -- most people only get Cat 1 or 2) • Energy goes up with the SQUARE of the wind speed • Much stronger with height -- As much as 1 or more categories stronger at 300-500 ft above sfc • Gusts can cause some of the greatest damage -- Like a battering ramCan add more than 25-30% of windsGusts for 75mph hurricane can reach 100mph or more! • Shifts in wind direction-- (e.g., if eye passes over) can cause a lot of extra stress to buildingsEach storm can bring winds from a different direction to buildings • Duration of winds -- affected byHow slowly the storm moves by and how large the wind field is.Hurricane force winds can last only 1-2 hours, or several days!
Other Comments • Busy vs. “quiet” year:1992 -- “quiet” year (only 1 MH) -- Miami got Andrew!2005 -- One of the MOST active years -- Miami got nothing! • Early Season activity (June/July) -- Has almost NOTHING to do with rest of year1997 -- 4 storms in June/July -- but VERY slow year overall (El Niño)1998 -- 1 small TS in late July, then nothing else until late Aug. -- VERY busy year!2004 -- 1st storm of year in early August! VERY busy year --esp. for FL!When an June/July storm forms in deep tropics (other than western Caribbean, it indicates the year will be busy. Other early storms are not related to later activity AT ALL! • Big problem -- windows out in high-rise buildings -- offices can be devastated!PROTECT WHAT IS IMPORTANT TO YOU! • Short-range vs. long-range preparations. Know what to do when! • Several full 5 gallon gas containers, power invertors (for cars), portable power supplies, etc., Water, water, water, non-perishable (and no-cook) foods, special needs, etc. • What does 2007 hold?