Download
1 / 34
340 likes | 368 Vues
Explore the ecological definitions and biological responses to freshwater flows in bays and estuaries in Texas. Understand key scientific terms and the laws governing environmental protection in these vital ecosystems. Discover the importance of maintaining ecological health and productivity and how scientific indicators assess the viability and sustainability of estuarine systems.

E N D
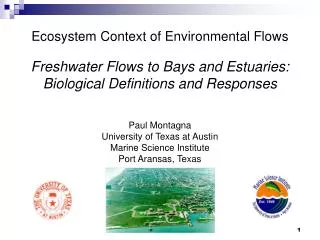
Paul Montagna University of Texas at Austin Marine Science Institute Port Aransas, Texas Ecosystem Context of Environmental Flows Freshwater Flows to Bays and Estuaries: Biological Definitions and Responses
Outline • Define key scientific terms • What is the scientific basis • What science has been done
Are flows to estuaries water run to waste? • No! It’s the law • 1985, HB 2 requires: “maintain a sound ecological environment” in Texas bays and estuaries. • 2001 HB 1629: “maintain the ecological health and productivity of the Matagorda Bay system.” • 2003, SB 1639 requires: “provide for the freshwater inflows necessary to maintain the viability of the state's bay and estuary systems.” • It’s not a “green issue,” it’s a water development issue • How can we provide water and still protect coastal resources?
So, are there scientific definitions of these terms? • Sound ecological environment • Ecological health • Viability of the bay and estuary systems • Productivity of a bay system
So, are “soundness,” “health,” and “viability” really fluffy words? • NO! • Ecological Health has been defined by scientists • The term is used EPA in specific contexts • Soundness and viability are clearly the same thing as health
Ecological health • Ecological health is assessed by determining if indicators of ecological conditions are in an acceptable range. • Indicators establish an acceptable range of responses across broad spatial and temporal scales. • Condition is the status of ecological function, integrity, and sustainability. • Function is acceptable when the ecosystem provides important ecological processes. • Integrity is acceptable when biological diversity, species composition, structural redundancy, and functional processes are comparable to that of natural habitats in the same region. • Sustainability is acceptable when an ecosystem maintains a desired state of ecological integrity over time.
What is biodiversity? Biological diversity
What is biodiversity? Biological diversity Biological diversity
What is biodiversity? Biological diversity Biological diversity Biodiversity
What is biodiversity? Biological diversity Biological diversity Biodiversity
Ecological indicators that work • Function • Ecological processes • Production, trophic links, reproduction • Integrity • Community structure and biodiversity • Benthos, nekton, plankton • Sustainability • Ecosystem services • Habitats, Habitats, Habitats
What is production? • Mass per unit area (volume) per unit time • Energy transformation • Follow the Sun • Primary production by plants • Phytoplankton, seagrass, macroalgae, marsh • Secondary production by animals • Microbes, benthos, plankton, nekton
Good (and not so good) indicators of production • Biomass or standing stock change over time • Good, but not perfect • Mass per unit area (volume), so missing time • Harvest • Not so good, • Effected mainly by regulation and economic conditions
Measuring condition • Understanding variability in space and time • Long-term studies over regional scales • Distinguishing between natural and anthropogenic effects • Comparison among systems with varying human influence
Applying indicators of ecological condition • Long-term studies of water quality and benthos over entire coastal bend • There is a link between inflow, nutrients, and primary production, but it is ephemeral • Benthos are fixed in place and sample that ephemeral water column • Benthos are the memory of the ecosystem
Questions guiding research • Can a direct link between flow and ecosystem services be made? • Can a direct link between nutrient loading and secondary production be made? • Can restoring flow restore an ecosystem?
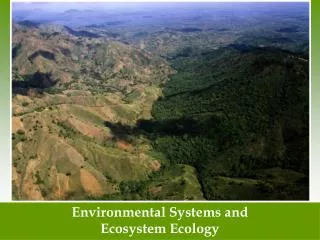
Climatic Gradient • Climatic and soil gradient from northeast to southwest. • Concordant rain gradient. • Southwestern estuaries are neutral, barely maintaining salinities below seawater. • Extreme year-to-year variability. • Water allocation is a problem where where it is scarce.
Long-term studies focused on SW, lagoonal estuaries of the Texas Coastal Bend Inflow balance 2 positive 2 neutral 2 negative LC GE MA NC LM BB Coastal BendL-T Studies
Benthic Change Over Time Period Modeled
Sun Day Fresh Water Light Length Inflows Outside Bay System Water Column Producer Water Bottom Nutrients Temperature Salinity Salinity Depth Fish Light Limitation Suspension Current (primary production) Speed Biomass Bottom Sediment C% Growth Predation Suspension-feeders Biomass Detritus Predation Growth (POC level ) Deposit-feeders Bioenergetic Productivity Model
Trophic response to inflow • Bays with high inflow have high suspension feeder production • Bays with low inflow have low deposit feeder production
Conclusions about flow indicators • Texas coast a great “natural experiment” • Nitrogen loading related to inflow • Residence times control community structure more than secondary production • Nitrogen loading adjusted for residence times related to benthic secondary production
Nueces River Basin ~1 million acre-ft storage capacity in 2 reservoirs Atascosa River Frio River Choke Canyon Dam (1982) Wesley Seale Dam (1958) Nueces River Nueces Delta/Marsh
Nueces Estuary Issues • Second dam built 1982. • 151,000 acre-ft/y required. • No releases due to drought and impoundment. • Salinity increased 3 fold.
Nueces Delta/Marsh effects • Nueces Marsh inflow reduced by dam building to near zero • Inflow events reduced from 3/y to 1/3 years La Fruta Dam Wesley Seale Dam Choke Canyon Dam
Past salinities were low Rangia cuneata middens found in Rincon Bayou. Rangia requires 5 - 10 ppt to reproduce.
Nueces Estuary, Texas USA-Restoration Efforts • Nueces River bank lowered to increase flooding of Rincon Bayou and marsh. • Salinities reduced from 150 ppt to 25 ppt, productivity and diversity increased. • City received inflow credit for marsh restoration (Adaptive Management). Channel
A little water goes a long way in Rincon Bayou • Just 100 ac-ft yields maximum productivity. • When salinity is lowered, abundance, biomass, and diversity increases • Optimal salinity around 20 ppt
Early Post Diversion (1998/99) Late Post Diversion (2003) Allison diversion projectRestored flow to lower part of Nueces Delta Thank you Ken Dunton
Conclusions about restored flows • The “reverse estuary” condition largely corrected. • A significant degree of estuarine function was restored to the delta. Partially Restored Salinity Gradient Delta 21-28 River Bay Gulf 0-1 15-30 30-36
Overall conclusions • Can define useful terms (“bay health”) in scientific ways • Can measure meaning ecological indicators • Can related indicators to ecosystem services • Can perform ecosystem management of flows • Can perform adaptive management