Data Analysis for Health Surveillance Officers
440 likes | 514 Vues
Learn data analysis techniques, outbreak detection, and surveillance strategies. Enhance skills in interpreting surveillance data for effective decision-making. Explore various data sources and types for public health monitoring.

Data Analysis for Health Surveillance Officers
E N D
Presentation Transcript
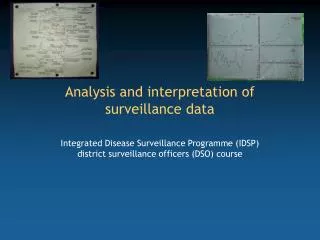
Analysis and interpretation of data IDSP training module for state and district surveillance officers Module 9
Learning objectives • Identify the role, importance and techniques of data analysis • Sources and management of data for valid conclusions • Choose appropriate descriptive and analytical methods • List outcome measures for feedback • Generate reports with tables and graphs
All levels must analyze surveillance data • Health workers • Increase of cases • Medical officers in primary health centres • Outbreak detection • Seasonal trends • District surveillance officers • All of the above • Advanced analyses
Selected outcomes of data analysis • Identification of outbreaks / potential outbreaks • Identification of appropriate and timely control measures • Prediction of changes in disease trends over time • Identification of problems in health systems • Improvement of the surveillance system through: • Identification of regional differences • Identification of differences between the private and the public sectors • Identification of high-risk population groups
Sources of data • Sub-Centre • Primary health centre • Community health centre • District • Private practitioners • Private nursing homes • Identified laboratories • Medical colleges • Police departments • State
Types of data • Syndromic case data • Presumptive case data • Confirmed case data • Sentinel case data • Regular surveillance data • Urban data • Rural data
Periodicity of data collection • Weekly • High priority (Acute flaccid paralysis) • As soon as a case is detected • Data on outbreaks are collected and analyzed separately
Analysis of data at the district surveillance unit • Computer software provides ready outputs • District surveillance officer prepares a report • Technical committee reviews and needs to bear in mind: • The strength and weakness of data collection methods • Reliability and validity of data • The separate disease profiles • The user-friendliness of graphs • The need to calculate rates before comparisons
Skills Contact reporting units for missing information Interpret laboratory tests Make judgment about: Epidemiologic linkage Duplicate records Data entry errors Declare a state of outbreak Attitudes Looking Thinking Discussing Taking action What computers cannot do
Concerns commonly expressed Statistics are difficult Multivariate analysis is complex Presentation of data is challenging Expressed concerns versus reality Mistake commonly observed • Data are not looked at
Basic surveillance data analysis • Count, divide and compare • Direct comparisons between number of cases are not possible in the absence of the calculation of the incidence rate • Descriptive epidemiology • Time • Place • Person
1. Count, Divide and Compare (CDC) • Count • Count cases that meet the case definition • Divide • Divide cases by the population denominator • Compare • Compare rates across: • Age groups • Districts • Etc.
2. Time, place and person descriptive analysis • Time • Graph over time • Place • Map • Person • Breakdown by age, sex or personal characteristics
A. Analysis over time • Absolute number of cases • Does not allow comparisons • Analysis by week, month or year • Incidence • Allows comparisons • Analysis by week, month or year
Absolute number of cases per week Acute hepatitis (E) by week, Hyderabad, AP, India, March-June 2005 120 100 80 Number of cases 60 40 20 0 1 8 15 22 29 4 12 19 26 3 10 17 24 31 7 14 21 28 March April May June First day of week of onset Interpretation: The source of infection is persisting and continues to cause cases
Incidence by year Reported varicella and typhoid cases, Darjeeling district, West Bengal, India, 2000-4 Interpretation: The parallel increase between varicella (that should be constant) and typhoid suggests that increasing rates of typhoid are secondary to improved reporting
2. Analysis by place • Number of cases by village or district • Does not control for population size • Spot map • Incidence of cases by village or district • Controls for population size • Incidence map
Spot map of absolute number of cases Reported cases of measles, Cuddalore district, Tamil Nadu, Dec 2004 – Jan 2005 Annagraman Interpretation: Cases were reported from tsunami affected non-affected areas, thus the cluster was not a consequence of the tsunami Cuddalore Panruti Parangipattai Kurinjipadi Vridha-chalam Kamma-puram Bhuvanagiri Mangalore Keerapalayam Nallur Kumaratchi Kattumannar Kail
Incidence by area Incidence of acute hepatitis (E) by block, Hyderabad, AP, India, March-June 2005 Attack rate per100,000 population 0 1-19 20-49 50-99 100+ Open drain Interpretation: Blocks with hepatitis are those supplied by pipelines crossing open sewage drains Pipeline crossing open sewage drain
3. Analysis per person • Distribution of cases by: • Age • Sex • Other characteristics(e.g., Ethnic group, vaccination status) • Incidence by: • Age • Sex • Other characteristics
Distribution of cases according to a characteristic Immunization status of probable measles cases, Nai, Uttaranchal, India, 2004 19% 81% Immunized Unimmunized Interpretation: The outbreak is probably caused by a failure to vaccinate
Incidence according to a characteristic Probable cases of cholera by age and sex, Parbatia, Orissa, India, 2003 Nu m b e r of c a s es Po pu l a t i on I nc i d e nc e A g e g r o up 0 t o4 6 1 1 3 5 . 3 % ( In y e ar s ) 5 t o1 4 4 1 9 0 2 . 1 % 1 5 to 2 4 5 1 2 8 3 . 9 % 2 5 to 3 4 5 1 4 4 3 . 5 % 3 5 to 4 4 6 1 2 9 4 . 7 % 4 5 to 5 4 4 8 8 4 . 5 % 5 5 to 6 4 8 6 7 1 1 . 9 % > 6 5 3 8 7 3 . 4 % S ex M a l e 1 7 4 8 1 3 . 5 % F e m a l e 2 4 4 6 5 5 . 2 % Tot al T ot a l 4 1 9 4 6 4 . 3 % Interpretation: Older adults and women are at increased risk of cholera
Seven reports to be generated • Timeliness/completeness • Description by time, place and person • Trends over time • Threshold levels • Compare reporting units • Compare private / public • Compare providers with laboratory
Report 1: Completeness and timeliness • A report is said to be on time if it reaches the designated level within the prescribed time period • Reflects alertness • A report is said to be complete if all the reporting units within its catchment area submitted the reports on time • Reflects reliability
Report 2: Weekly/ monthly summary report • Based upon compiled data of all the reporting units • Presented as tables, graphs and maps • Takes into account the count, divide and compare principle: • Absolute numbers of cases and deaths are sufficient for a single reporting unit level • Incidence rates are required to compare reporting units
Epidemiological indicators to use in weekly / monthly summary report • Cases • Deaths • Incidence rate • Case fatality ratio
Report 3: Comparison with previous weeks/ months/ years • Help detect trend of diseases over time • Weekly analysis compare the current week with data from the last three weeks • Alerts authorities for immediate action • Monthly and yearly analysis examine: • Long term trends • Cyclic pattern • Seasonal patterns
Example of weekly analysis Acute hepatitis by week of onset in 3 villages, Bhimtal block, Uttaranchal, India, July 2005 90 80 70 60 50 Number of cases 40 30 20 10 0 1st week 3rd week 1st week 1st week 1st week 1st week 3rd week 3rd week 3rd week 4th week 4th week 4th week 2nd week 4th week 2nd week 2nd week 2nd week May June July August September Week of onset Interpretation: The second week of July has a clear excess in the number of cases, providing an early warning signal for the outbreak
Example of monthly and yearly analysis Malaria in Kurseong block, Darjeeling District, West Bengal, India, 2000-2004 45 40 Incidence of malaria 35 Incidence of Pf malaria 30 25 Incidence of malaria per 10,000 20 15 10 5 0 May July July July July July May May May May April April April April April June June June June June March March March March March August August August August August January October January October January October January October January October February February February February February November December November December November December November December November December September September September September September 2000 2001 2002 2003 2004 Months Interpretation: There is a seasonality in the end of the year and a trend towards increasing incidence year after year
Report 4: Crossing threshold values • Comparison of rates with thresholds • Thresholds that may be used: • Pre-existing national/international thresholds • Thresholds based on local historic data • Monthly average in the last three years (excluding epidemic periods) • Increasing trends over a short duration of time (e.g., Weeks)
Report 5: Comparison between reporting units • Compares • Incidence rates • Case fatality ratios • Reference period • Current month • Sites concerned • Block level and above
Report 6: Comparison between public and private sectors • Compare trends in incidence of new cases/deaths • Incidences are not available for private provider since no population denominators are available • Good correlation may imply: • The quality of information is good • Events in the community are well represented • Poor correlation may suggest: • One of the data source is less reliable
Report 7: Comparison of reports between the public health system and the laboratory
Review of analysis results by the technical committee • Meeting on a fixed day of every week • Review of a minimum of: • 4 reports weekly • 7 reports monthly • Review by disease wise • Search for missing values • Check the validity • Interpret • Prepare summary reports and share • Take action
Limitations in analysis of surveillance data • The quality of data may be problematic • Poor use of case definition • Under-reporting • There may be a time lag between detection, reporting and analysis • Under-reporting occurs • However, if the level of under-reporting is constant, trends may still be analyzed and outbreaks may still be detected • The representativeness may be poor • Engage the private sector to diversify reporting sources
Conclusion • Analysis is a major component of surveillance – links data collection and program implementation • While it is important to analyze data, its also important that analyzed reports are sent to the appropriate authorities • Higher level • Lower level
Points to remember • Surveillance data identifies outbreaks and describe conditions by time, place and person • Surveillance helps monitor disease control and assess the impact of services • Data analysis must occur at each level • Analyzed data is presented in tables, graphs with comparisons with previous data