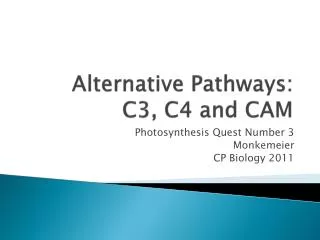
Alternative Cropping Systems…
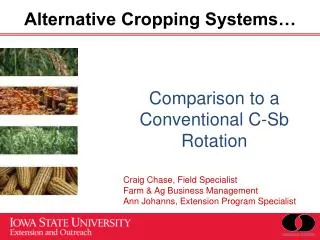
Alternative Cropping Systems…. Comparison to a Conventional C- Sb Rotation. Craig Chase, Field Specialist Farm & Ag Business Management Ann Johanns, Extension Program Specialist. Yields by Crop/Rotation. NOTE: The C- Sb -O rotation includes red clover.

Alternative Cropping Systems…
E N D
Presentation Transcript
Alternative Cropping Systems… Comparison to a Conventional C-Sb Rotation Craig Chase, Field Specialist Farm & Ag Business Management Ann Johanns, Extension Program Specialist
Yields by Crop/Rotation NOTE: The C-Sb-O rotation includes red clover
Things to Note • Soybean varieties used in the 2 year rotation differed from the other rotations beginning in 2006; corn hybrids used in the 2 year rotation differed from the other rotations beginning in 2008. • Main difference between rotations is fertilizer and pesticide applications. The LEI rotations have significantly less fertilizer and pesticide applied. • Used different herbicides and applied by banding • Only cost associated with manure in initial study is the cost to apply • Prices for 2011 are USDA NASS average for October-December 2011.
Bottom Line • Production costs for LEI corn is approximately $150-175 less per acre; $25-50 less for LEI soybeans. • This spread has widened as fertilizer and pesticide costs have increased.
Inclusion of oats and alfalfa • Strongly-held belief: inclusion of oats and alfalfa make the organic rotation not competitive with the conventional C-Sb rotation. • Let’s take a look…
Things to note… • 2010 was a huge year for revenues for conventional corn and soybeans. • Production expenses increased at a higher rate than revenue from 2008-09 for conventional corn and soybeans. • The LEI system had its highest economic return in 2011 (3-yr and 4-yr) led by corn, and hasn’t seen any negative or low numbers (below $69/ac) from 2006 on.
Things to note… • Fertilizer is added on an as-needed basis • Purchased fertilizer was added on every rotation in 2010 resulting in lower than expected economic returns compared to 2011.
Focus on the right number… • Just because you bring in more money doesn’t mean you are keeping any more of it yourself… • So focus on economic returns, not prices or revenue... Family living and other personal bills are paid out of net returns not gross revenue.
Average Returns to Land, Labor, and Management by Crop Rotation, 2006-2011
Fertilizer makes all the difference… • Used fertilizer equivalents from manure analysis and the annual costs to calculate economic returns had the manure been purchased.
Average Returns to Land, Labor, and Management by Crop Rotation, 2006-2011 – with fertilizer equivalents for manure applied
Management practices used for corn and soybean in each rotation system, 2008-2010
Average Returns to Land and Management, by Crop Rotation, GE comparison
Average Returns to Land and Management, by Crop Rotation, GE comparison
Production costs as affected by rotation and management, 2008-2010 * Does not include land, does include labor Source: Gomez et al., in review
Net returns to land and management as affected by rotation and management, 2008-2010 Source: Gomez et al., in review
Energy Usage by Rotation • Measured usage in energy within the field, and energy available for purchase (solar energy not included). • Doesn’t take into consideration energy for seed, storage, delivery, etc. • Corn takes the bulk of the energy usage in all rotations. • Fertilizer is the leading category in the 2-year rotation, but as might be expected, field operations are the highest usage category for the 3 and 4-year rotations.
Energy Input per Crop for Individual Rotations 2006-2011 average for each rotation
Distribution of Energy Inputs in Cropping Rotations by Selected Energy Categories, 2006-2011
Diesel Fuel Equivalents2006-2011 *Assumed 138,690 BTU per gallon of diesel fuel. (EIA)
Bottom Line Conventional prices and revenues are historically high. Fertilizer, pesticides, seed, etc. costs have increased dramatically reducing net economic returns to conventional production. LEI systems allow for equal to higher returns with less purchased inputs.
Questions….. Any questions or comments? Thank You for This Opportunity! Craig A. Chase Farm Management Field Specialist 312 Westbrook Lane Ames, IA 50014 (319) 238-2997 cchase@iastate.edu http://www.extension.iastate.edu/agdm/fieldstaff/cchase.html