Download
1 / 10
100 likes | 115 Vues
This study explores the hypothesis of solar heating causing rock fractures. Students use discovery learning to measure fracture orientations on boulders and create hypotheses. The data collected is used to plot rose diagrams, leading to discussions on fracture origins. Various student hypotheses are analyzed, revealing misconceptions and interesting interpretations. The study supports teaching earth processes using hands-on field experiences.

E N D
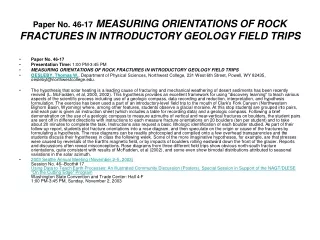
Paper No. 46-17 Presentation Time: 1:00 PM-3:45 PM MEASURING ORIENTATIONS OF ROCK FRACTURES IN INTRODUCTORY GEOLOGY FIELD TRIPS OESLEBY, Thomas W., Department of Physical Sciences, Northwest College, 231 West 6th Street, Powell, WY 82435, oeslebyt@northwestcollege.edu. The hypothesis that solar heating is a leading cause of fracturing and mechanical weathering of desert sediments has been recently revived (L. McFadden, et al, 2000, 2002). This hypothesis provides an excellent framework for using "discovery learning" to teach various aspects of the scientific process including use of a geologic compass, data recording and reduction, interpretation, and hypothesis formulation. The exercise has been used a part of an introductory-level field trip to the mouth of Clark's Fork Canyon (Northwestern Bighorn Basin, Wyoming) where, among other features, students observe a glacial moraine. At this stop students are grouped into pairs, and each pair is given an instruction sheet (which includes a table for recording data) and a geologic compass. Following a brief demonstration on the use of a geologic compass to measure azimuths of vertical and near-vertical fractures on boulders, the student pairs are sent off in different directions with instructions to each measure fracture orientations on 20 boulders (ten per student) and to take about 20 minutes to complete the task. Instructions also request a basic lithologic identification of each boulder studied. As part of their follow-up report, students plot fracture orientations into a rose diagram, and then speculate on the origin or cause of the fractures by formulating a hypothesis. The rose diagrams can be readily photocopied and compiled onto a few overhead transparencies and the students discuss their hypotheses in class the following week. Some of the more imaginative hypotheses, for example, are that stresses were caused by reversals of the Earth's magnetic field, or by impacts of boulders rolling eastward down the front of the glacier. Reports and discussions often reveal misconceptions. Rose diagrams from three different field trips show obvious north-south fracture orientations, quite consistent with results of McFadden, et al (2002), and some even show bimodal distributions attributed to seasonal variations in the solar azimuth. 2003 Seattle Annual Meeting (November 2–5, 2003)Session No. 46--Booth# 17Using Data to Teach Earth Processes: An Illustrated Community Discussion (Posters). Special Session in Support of the NAGT/DLESE "On the Cutting Edge" ProgramWashington State Convention and Trade Center: Hall 4-F1:00 PM-3:45 PM, Sunday, November 2, 2003 Paper No. 46-17 MEASURING ORIENTATIONS OF ROCK FRACTURES IN INTRODUCTORY GEOLOGY FIELD TRIPS
- on outwash in front of a Pinedale-age moraine (below), - and on top of the same moraine (above; Heart Mountain is in the distance). Data were collected from two locations in Clark’s Fork Canyon:
Students work in pairs and are instructed to select large boulders with vertical fractures. They learn to use the Suunto- (or Silva-) brand geologic compass in a matter of minutes. They record fracture azimuth and lithology on tables. Comments may include whether rocks are foliated and, if so, whether the fracture is parallel to foliation. Spot observations by the instructor suggest the data are reasonably accurate, although this remains an open question.
Sample rose diagrams • Pairs of rose diagrams from four student teams are compiled onto an overhead to be used during class discussion. Left diagrams are from outwash; right diagrams are from moraine crest. • (Several of these diagrams show a preferred North-South orientation, as predicted by McFadden’s hypothesis.) • (Differences between team results might reflect natural variability, student error, or sampling bias.) • Students submit a field trip report and are requested to include a hypothesis explaining their data as well as a proposed method to test their hypothesis. • Following are a few examples from student reports.
Julie and Lacie collected these data from the moraine summit (left) and outwash plain (right). The excerpt from Julie’s report shows her interpretation fits their data quite well. Note that their summit data are very inconsistent with solar heating.
Kirk’s data appear random; he proposed a test for temperature/freeze-thaw cycling
Duke concluded the boulders were fractured during final deposition. His handwritten explanation includes a test of his hypothesis, but he chose to not include it in his final report.
Saturday field trip, fall of 2002 This class was taught on Monday evenings; students were mostly non-traditional. The author, Rev. Keller, is a retired Episcopal priest with a wonderful imagination. We had discussed various theories in the field, immediately after collecting and plotting fracture data.
Conclusions • Students quickly learn to use the geologic compass. • Spot observations suggest their data are accurate. Some, but not all, of the results are consistent with McFadden’s hypothesis. Because student teams are requested to spread out, each team samples a different sub-population of fractures; this seems a likely cause of sometimes striking differences in results. • Interpretations are often consistent with data and many are quite imaginative. • Although students usually submit a field-trip report, they commonly do not complete the required write-up of their hypothesis and test. This suggests to me they are reluctant to express their ideas. • The exercise provides a opportunites to go beyond basic geologic observation and to tie in various classroom concepts; it also provides a forum for discussing the scientific process.