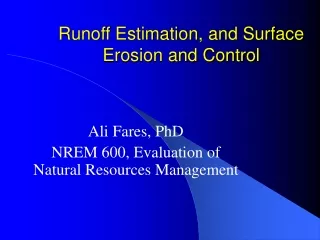
Runoff Estimation, and Surface Erosion and Control
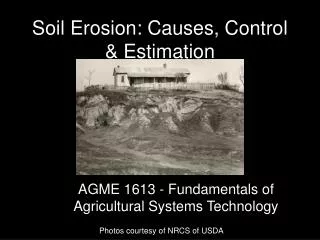
Runoff Estimation, and Surface Erosion and Control. Ali Fares, PhD NREM 662, Watershed Hydrology. THE SOIL WATER EROSION PROCESS. EFFECTS ON ENVIRONMENTAL QUALITY AND PRODUCTIVITY. LOSS OF OM, CLAY, AND NUTRIENTS REDUCES PRODUCTIVITY DAMAGE TO PLANTS

Runoff Estimation, and Surface Erosion and Control
E N D
Presentation Transcript
Runoff Estimation, and Surface Erosion and Control Ali Fares, PhD NREM 662, Watershed Hydrology
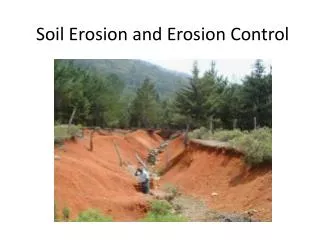
EFFECTS ON ENVIRONMENTAL QUALITY AND PRODUCTIVITY • LOSS OF OM, CLAY, AND NUTRIENTS REDUCES PRODUCTIVITY • DAMAGE TO PLANTS • FORMATION OF RILLS AND GULLIES AFFECTS MANAGEMENT • SEDIMENTATION IN WATERWAYS, DIVERSIONS, TERRACES, DITCHES • DELIVERY OF NUTRIENTS TO SURFACE WATER
Standard USLE plot: • 22.1m (72.6 ft) long • 9% slope • 4m (13.12 ft) wide.
USLEUniversal Soil Loss Equation • Wischmeier, W.H. and D.D. Smith. 1978. Predicting rainfall erosion losses. USDA Agriculture Handbook 537, U.S. Department of Agriculture.
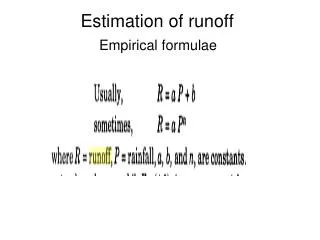
Empirical model: • Analysis of observations • Seeks to characterize response from these data. • Based on: • Rainfall pattern, soil type, topography, crop system and management practices. • Predicts: • Long term average annual rate of erosion • Subroutine in models such as: • SWRRB (Williams, 1975), EPIC (Williams et al., 1980), ANSWERS (Beasly et al., 1980), AGNPS (Young et al., 1989)
The equation: A = R x K x LS x C x P • A = average annual soil loss (tons/acre year) • R = rainfall and runoff erosivity index • K = soil erodibility factor • L = slope length factor • S = slope steepness factor • C= crop/management factor • P = conservation or support practice factor
R (rainfall and runoff erosivity index) • Erosion index (EI) for a given storm: • Product of the kinetic energy of the falling raindrops and its maximum 30 minute intensity. • R factor =EI over a year / 100 A =R x K x LS x C x P
K(soil erodibility) • Susceptibility of a given soil to erosion by rainfall and runoff. • Depend on: • Texture, structure, organic matter content, and permeability. A =R x K x LS x C x P
LS(slope length-gradient) • Ratio of soil loss under given conditions to that at a site with the "standard" slope and slope length. A =R x K x LS x C x P
Crop Tillage Factor Factor Fall Plow Grain Corn 1.00 0.40 Silage Corn, Beans & Canola Spring Plow 0.90 0.50 Cereals (Spring & Winter) Mulch Tillage 0.60 0.35 Seasonal Horticultural Crops Ridge Tillage 0.35 0.50 Fruit Trees Zone Tillage 0.25 0.10 No-Till Hay and Pasture 0.25 0.02 C(crop/management) • Ratio of soil loss from land use under specified conditions to that from continuously fallow and tilled land. A =R x K x LS x C x P
Support Practice P Factor Up & Down Slope 1.00 Cross Slope 0.75 Contour farming 0.50 Strip cropping, cross slope 0.37 Strip cropping, contour 0.25 P(conservation practices) • Ratio of soil loss by a support practice to that of straight-row farming up and down the slope. A =R x K x LS x C x P
RUSLE: Revised Universal Soil Loss Equation • USDA Agriculture Handbook 703(Renard et. al. 1997) • USLE factor values: updated, expanded, improved. • Expanded isoerodents • Ponded water on the soil • Freeze-thaw cycle and soil moisture • Complex slopes • Conservation tillage and crop rotation • Software
WHAT IS RUSLE 2 • “GREAT GRANDSON” OF USLE • MODEL TO PREDICT SOIL LOSS • WHERE OVERLAND FLOW OCCURS • COMPUTES ANNUAL SHEET/RILL EROSION • COMPUTES PARTICLE DISTRIBUTION AND RUNOFF • CROPLAND, FOREST, LANDFILLS, CONSTRUCTION SITES, SURFACE MINES • WINDOWS “PULL DOWN” MENUS
WHO AND WHAT OF RUSLE 2 • USDA-ARS, USDA-NRCS, VARIOUS UNIVERSITIES • ON-GOING PROCESS OVER 70 YEARS • THOUSANDS OF RESEARCH DATA • SET UP WITH VARYING LEVELS OF COMPLEXITY • COMPUTER REQUIREMENTS • WINDOWS 98 • INTERNET EXPLORER BROWSER • 64 MB RAM • DOWNLOAD • HTTP://BIOENGR.AG.UTK.EDU/RUSLE2/
APPLICABILITY OF RUSLE 2 • ESTIMATES INTER-RILL AND RILL EROSION • ESTIMATES SEDIMENT YIELD FROM OVERLAND FLOW AND TERRACE CHANNELS • DOES NOT ESTIMATE EPHEMERAL OR PERMANENT GULLIES, MASS WASTING, OR STREAM CHANNEL EROSION • BEST SUITED TO CROPLAND, BUT IS USEFUL FOR CONSTRUCTION SITES, LANDFILLS, RECLAMATION PROJECTS, AND DISTURBED FOREST LAND
APPLICABILITY OF RUSLE 2 (cont.) • BEST WHERE RAINFALL IS REGULAR AND EXCEEDS 20”/YR. • MEDIUM-FINE TEXTURED SOILS • SLOPES 3-20% AND LESS THAN 600 FT. • BEST AT CALCULATING “AVERAGE ANNUAL SOIL LOSS”, NOT RECOMMENDED FOR SINGLE STORM EVENTS
RUSLE 2 FACTORS A = R x K x LS x C x P • CLIMATE (R) AND SOIL (K) FACTORS ARE SET FOR A GIVEN FIELD • SLOPE GRADE (S) AND LENGTH (L) CAN BE ADJUSTED WITH DIFFICULTY • MOST FLEXIBILITY WITH COVER MGT. (C) AND SUPPORTING PRACTICES (P)
EROSION CONTROL PRACTICES Structures: diversions, terraces, waterways • Reduce slope length • Slow runoff velocity • Divert excess water safely • Avoid runoff over barnyard, feedlots, etc.
CONTOUR TERRACES Grant Co.
EROSION CONTROL PRACTICES Management practices • Cover crops • Crop residue management • 30% residue reduces erosion 50-60% • Contour tillage • Slope < 8% and 300’ long • Contour strip cropping and buffers • Alternating sod strip for steep land
Controlling Water contaminants at the Source, Kaiaka-Waialua Watershed
Kaiaka and Waialua bays, are water quality limited segments due to high levels of total P, NO-3, chlorophyll a, and turbidity exceeding the maximum allowable levels (HI-DOH). • Sediment loads from agricultural lands and effluent discharged from household cesspools are two of the major sources of pollution. • Sediment losses are generated from cropped and fallow zones as a result of an intensive agricultural system that includes a crop/fallow cropping combination.
Objectives • The goal of this project is to implement and demonstrate erosion control practices to help manage erosion throughout Kaiaka-Waialua watershed, thereby reducing sediment and potential pollutant loads (P, N) into the surface water resources, and consequently improving water quality of the coastal area.
Materials and Methods • Field in a commercial farm, • Ewa Silty clay soil, a mean Ksat = 3.5 cm d-1 (Candler 15 m d-1) • Three cover crops (Sunn hemp, Sudex & Oats) were replicated 3 times in a RCB design. • Suction cups were installed in each plot to collect soil solution • Surface runoff was collect from each plot following rainfall. • Soil water contents (10,20,30 & 50cm) from each treatment
Materials and Methods • Soil physical properties were determined: Ksat, BD & soil water release curve • Soil samples were collected before, in the middle and at the end of the trial. • Total dissolved and total suspend solids (TDS, TSS) were determined (EPA’s 160.1, 160.2 methods) • NO3, NH4 and P were determined by UH-ADSC
Subsurface Water Quality Analysis • Collected soil solution samples were analyzed at the University of Hawai’i (ADSC) for: • Ammonium • Nitrate • Total Nitrogen and • Phosphorus
Results • Runoff water quality • Subsurface water quality
292 mm occurred in 11 hr, 2/27 at a rate of 24 mm hr-1 March 3 May 18 April 27 March 31 April 18 03-16 March 22 March 25 April 22 April 7
Oats Sunn hemp Fallow Sudex Surface Runoff Collection
Runoff water Quality • TSS, 70% there was statistically significant treatment effect • Nitrate, 50% there was statistically significant treatment effect • Ammonium, 40% there was statistically significant treatment effect • TN, 60% there was statistically significant treatment effect
Removal Efficiencies • Calculation for Removal Efficiencies (RE): • RE = [1- (Cover Crop (g) / Fallow (g))]x100 • A positive RE means that there was a reduction in pollutant levels in comparison to the fallow • A negative RE means that there was an increase in pollutant levels in comparison to the fallow treatment
A A A A B A B B