
Optical and NIR Luminosity-Metallicity Relations in Star-Forming Galaxies
Investigating the Luminosity-Metallicity Relationship in Low-Luminosity HII Galaxies and Comparing with Dwarf Irregulars, using Nebular Oxygen Abundances obtained through the Direct Te Method and Strong-Line Abundance Estimator Calibration.

Optical and NIR Luminosity-Metallicity Relations in Star-Forming Galaxies
E N D
Presentation Transcript
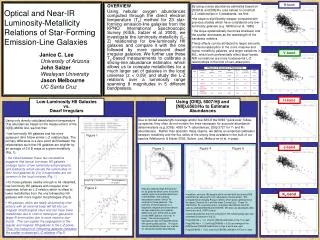
Figure 1 We have obtained high S/N spectra for 23 galaxies which cover the entire optical region and include detections of [OIII]l 4363. We compute abundances via the “direct” Te method for these galaxies. The positions of these galaxies in a diagnostic diagram are shown above as open diamonds (Lick spectra, Melbourne et al. 2004) and as open circles (MMT spectra, Lee et al. in prep.) The remaining points represent all star-forming KISS ELGs with good quality spectra. The figure also schematically shows our method for calculating coarse abundances. In addition, we have 185 spectra which contain both the strong [OIII] and [OII] lines allowing for a R23 abundance measurement. We compute these following Pilyugin (2000), which gives calibrations for the upper Z branch (R23) and the lower Z branch (p3). These Te (diamonds), R23 (squares) and p3 (triangles) abundances are then used to calibrate [NII]/Ha and [OIII]/HB. We also use abundaces data from Izotov et al. (1997) (stars). Coarse abundances are then computed in the following way (also see schematic illustration in Fig. 3): If log([NII]/Ha) < -1.2, only the [NII]/Ha calibration in Fig. 5 is used. If log([NII]/Ha) > -1.2 and log([OIII]/HB) >-0.25, an average of the [NII]/Ha and [OIII]/HB calibrations in Figs 4 and 5 are used. If log([OIII]/HB) < -0.25, only the [OIII]/HB calibration in Fig.4 is used. B-band • By using coarse abundance estimates based on [OIII]/Hb and [NII]/Ha (see below) to construct L-Z relationships in 5 passbands, we find: • the slope is significantly steeper compared with previous studies which have considered only low-luminosity galaxies (e.g. Skillman et al. 1989) • the slope systematically becomes shallower and the scatter decreases as the wavelength of the bandpass reddens • These effects can be attributed to larger amounts of internal absorption in the more massive and higher metallicity galaxies, and larger variations in M/L, which both preferentially affect bluer bands. NIR correlations are more fundamental L-Z relationships in the limit of zero absorption. Optical and Near-IR Luminosity-Metallicity Relations of Star-Forming Emission-Line GalaxiesJanice C. Lee University of ArizonaJohn SalzerWesleyan UniversityJason MelbourneUC Santa Cruz V-band Results of Bivariate L-Z Relation Fits H-band Low-Luminosity HII Galaxies vs. Dwarf Irregulars Using [OIII]l 5007/Hb and [NII]l6563/Ha to Estimate Abundances • Using only directly calculated electron temperature (Te) abundances based on the measurement of the O[III]l4363A line, we find that: • low-luminosity HII galaxies and the more quiescent dIrrs follow similar L-Z relationships. The primary difference is a zero-point shift between the relationships such that HII galaxies are brighter by an average of 0.8 B mags at a given metallicity (Fig. 1). • the offset between these two correlations suggests that typical low-mass HII galaxies undergo factor of two luminosity enhancements, and starbursts which elevate the luminosities of their host galaxies by 2 to 3 magnitudes are not common in the local universe (Fig. 1). • for those galaxies nearby enough to be classified, low-luminosity HII galaxies with irregular inner isophotes follow an L-Z relation which is offset to lower metallicities from the one followed by HII galaxies with more regular morphologies (Fig 2). • HII galaxies which are tidally disturbed by inter-actions with an external body will fall into our irregular morphological class and can have lower metallicities due to infall of metal-poor gas and/or larger B-luminosities due to more massive star-bursts. This can explain the segregation of the regular and irregular HII galaxies in the L-Z plane. Thus, the inclusion of interacting galaxies increases the scatter in observed L-Z relations (Fig 2). Due to limited wavelength coverage and/or low S/N of the KISS “quick-look” follow-up spectra, they often do not contain the lines necessary for accurate abundance determinations (e.g. [OIII]l 4363 for Te abundances, [OII]l3727 for Te and R23 abundances). Rather than abandon these objects, we define an empirical calibration between metallicity and the flux ratios of the strong lines available in the bulk of our spectra (Melbourne & Salzer 2002, Salzer, Lee, Melbourne et al. in prep). OVERVIEW Using nebular oxygen abundances computed through the direct electron temperature (Te) method for 23 star-forming emission-line galaxies from the KPNO International Spectroscopic Survey (KISS, Salzer et al. 2000), we investigate the luminosity-metallicity (L-Z) relationship for low-luminosity HII galaxies and compare it with the one followed by more quiescent dwarf irregular galaxies. We further use these Te-based measurements to calibrate a strong-line abundance estimator, which allows us to compute metallicities for a much larger set of galaxies in the local universe (z < 0.09) and study the L-Z relations over a luminosity range spanning 8 magnitudes in 5 different bandpasses. J-band Figure 4 Figure 5 Figure 3 In both Fig. 1 and Fig. 2: ____ Fit to HII galaxies ---- Fit to dIrrs Figure 2 Ks-band


