START
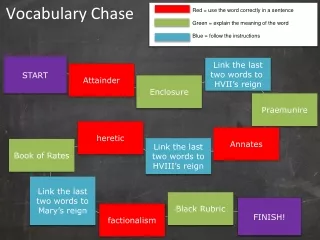
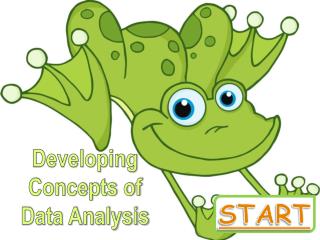
Developing Concepts of Data Analysis. START. A big conceptual idea in data analysis can be referred to as:. Attribute Materials. Shape of data. Statistics. Venn Diagram. S. RRY. GO BACK. CORRECT!. GOOD JOB!!!!. Next. START. Next.

START
E N D
Presentation Transcript
Developing Concepts of Data Analysis START
A big conceptual idea in data analysis can be referred to as: • Attribute Materials • Shape of data • Statistics • Venn Diagram
S RRY GO BACK
CORRECT! GOOD JOB!!!! Next
START Next
A collection, analysis, interpretation or explanation, and presentation of data. • Statistics • Venn Diagram • Bar Graph • Box Plot
S RRY GO BACK
CORRECT! GOOD JOB!!!! Next
START Next
A method for visually displaying not only the center (median) but also the range and spread of data. • Venn Diagram • Box Plot • Real Graph • Bar Graph
S RRY GO BACK
CORRECT! GOOD JOB!!!! Next
START Next
Any set of objects that lend themselves to being sorted and classified in different ways. • Statistics • Average • Attribute • Materials • Mean
S RRY GO BACK
CORRECT! GOOD JOB!!!! Next
START Next
A diagram representing mathematical or logical sets pictorially as circles or closedcurves within an enclosing rectangle,common elements of the sets being represented by the areas of overlapamong the circles • Venn Diagram • Stem and leaf • Real Graph • Circle Graph
S RRY GO BACK
CORRECT! GOOD JOB!!!! Next
START Next
This is an example of: • Line Plot • Box Plot • Steam-and-leaf • plots • Scatter Plots
S RRY GO BACK
CORRECT! GOOD JOB!!!! Next
START Next
This is an example of: • Bar Graph • Venn Diagram • Circle Graph • Real Graph
S RRY GO BACK
CORRECT! GOOD JOB!!!! Next
START Next
This is an example of: • Bar Graph • Venn Diagram • Circle Graph • Real Graph
S RRY GO BACK
CORRECT! GOOD JOB!!!! Next
START Next
This is an example of: • Line Plot • Box Plot • Steam-and-leaf • plots • Scatter Plots
S RRY GO BACK
CORRECT! GOOD JOB!!!! Next
START Next
Students are arranged in a circle withstring stretched from the center. • Circle Graph • Human Circle Graph
S RRY GO BACK
CORRECT! GOOD JOB!!!! Next
START Next
This is an example of: • Line Plot • Box Plot • Steam-and-leaf • plots • Scatter Plots
S RRY GO BACK
CORRECT! GOOD JOB!!!! Next
START Next
The mean is the quotient of the sum of several quantities and their number; an average. • True • False
S RRY GO BACK
CORRECT! GOOD JOB!!!! Next
START Next