Understanding School Performance: Analyzing Achievement Gaps and Effective Strategies
This discussion focuses on the critical analysis of school performance metrics, highlighting the importance of accurate measurements through various assessments. It emphasizes mobility rates, continuous cohort data, and the significant impact of socioeconomic factors such as free and reduced lunch (FRL) on achievement. Parents are guided through expert analyses, comparing district performance and identifying effective, innovative schools with high FRL rates. The presentation seeks to address gaps in achievement, explore long-term trends, and evaluate the effectiveness of current assessment practices.


Understanding School Performance: Analyzing Achievement Gaps and Effective Strategies
E N D
Presentation Transcript
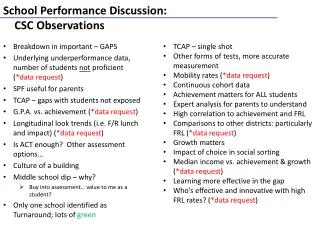
TCAP – single shot • Other forms of tests, more accurate measurement • Mobility rates (*data request) • Continuous cohort data • Achievement matters for ALL students • Expert analysis for parents to understand • High correlation to achievement and FRL • Comparisons to other districts: particularly FRL (*data request) • Growth matters • Impact of choice in social sorting • Median income vs. achievement & growth (*data request) • Learning more effective in the gap • Who’s effective and innovative with high FRL rates? (*data request) School Performance Discussion: CSC Observations Breakdown in important – GAPS Underlying underperformance data, number of students not proficient (*data request) SPF useful for parents TCAP – gaps with students not exposed G.P.A. vs. achievement (*data request) Longitudinal look trends (i.e. F/R lunch and impact) (*data request) Is ACT enough? Other assessment options… Culture of a building Middle school dip – why? Buy into assessment… value to me as a student? Only one school identified as Turnaround; lots of green
Additional Data Requests Raw number of students at each achievement level (Advanced, Proficient, Partially Proficient, and Unsatisfactory) G.P.A. vs. achievement Longitudinal look trends (i.e. F/R lunch and impact) Mobility rates by school Comparisons to other districts: particularly FRL Median income vs. achievement & growth List of schools with relatively high FRL rates and high achievement/growth