Download
1 / 25
250 likes | 353 Vues
This research explores measuring structural soundness and quality attributes of product line architecture through various metrics and case studies. The study aims to quantify properties for better software development.

E N D
Metrics for the Structural Assessment of Product Line Architecture Asim Rahman asim.rahman@gmail.com
Agenda • Introduction • Research Area • Reseach Methodology • Component Based Design • Service Utilization Concept • Structural Soundness • Measuring Strcutural Soundness • Measuring Quality Attributes • Case Study: Library System • Conclusions • Future Work
Introduction • Software Reuse • Software Product Lines (SPL) as a reuse approach • SA vs SPL Architecture • Variability is Software Systems • Architectural Assessments
Research Area & Questions • Questions? • How do we judge the qulaity of the structure of the architecture? • How to we quanitfy the Property? • How can this measure be used to build a better Product Line Architecture? • Motivation • Almost no published reseach in the area • Large amount of published papers in component based software engineering • Many PL approaches (KobrA, Jan Bosch, Clements) follow a component based approach
Component Based Design • Component is a unit of composition with contractually specified interfaces and explicit context dependencies...[Szyperski ’97]
Structural Soundness • components are divided, planned and then connected together in most effective way possible to provide a solution to a well defined problem. • SS cannot be gerneralized for all architectures – property should only be compared when two or more architecture provide solution to a similar problem
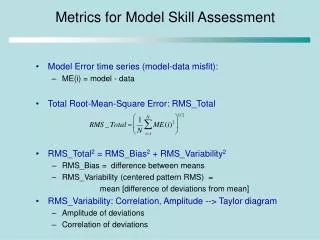
Measuring Structural Soundness • Four step model:Research Methodology • Identifying design/architecture properties (L1) • Identifying metrics to measure properties (L2) • Identifying measurable elements (L3) • Validating the metrics (L4)
Measuring Quality Attributes (i) • Observability • Ease with which a developer can peak into the component and learn about its fuctions • Behavior of the component is observed by read methods corresponding to the the read properties • Customizability • Ability or the extent to which a component can be configured, without changing its code • Writable properties are accessed by writable methods
Measuring Quality Attributes (ii) • Interface Complexity • Interface Signature • Properties,operations and events • Interface Constraints • Pre-conditions • Post-conditions • Range constraints on properties • Sequence of interface invocations • Interface Packaging and Configurations • Configurations a component can operate in
Measuring Quality Attributes (iii) • Self Completeness • SC measured by return value • SC measured by parameters
Measuring Quality Attributes (iv) • Provided Service Utilization • We use only the PSU value in order to determine the resuability of the components
Measuring Quality Attributes (v) • Maturity • Mature component tend to be more reusable • Less testing effort • Low probability of defects • More familiarity of developers with the component usage • Known behavior in multiple situations • Some characteristics also tend to decrease the probability of reuse • Increase in size • Non-conformance from component model
Measuring Quality Attributes (vi) • ...Maturity • Measures to quantify maturity • # of faults in requirement and design • # of open faults • # of closed faults • Avg. # of days a fault remains • Avg. # of days to close a fault • Avg. age of a fault
Measuring Quality Attributes (vii) • Modularity • Measured by TREE IMPURITY [Fenton ’97] • Considering Optionality
Case Study: Library System (i) • Based on Case Study performed by Fraunhofer Institute of Experimental Studies • Product Line of Library Systems (German Libraries) • Limitations of the Case Study • Few details on operation/service (return val & param) • Scarce information on range constraints on properties • Sequence of method invocation was missing • No details of maturity measures • Variabilty was low
Case Study: Library System (iii) • Correlation Analysis of Quality Attributes • Check for mullticollinearity • If strong correlation is found between two quality attributes, then one of the two metrics must be selected • Multicollinearity • Conservative: R ≤ 0.5 • Liberal: If relation between variable remain constant, then multicollinearity is not a problem • Jenson: R ≤ 0.9 • Reasons: • Dont want to double count • Dont expect to have large data points • Carefully categorized quality attributes; hence slight indication of correlation is alarming
Case Study: Library System (iv) • Analysis Test Selection • Analysis of Component Level Metrics
Case Study: Library System (v) • Analysis of the Architecture Level Metrics
Case Study: Library System (vi) • Wilcoxon Signed Rank Test • SCp and SCr (W = 36, N = 8) • Level of Significance = 0.005 (Directional Test) • PSU and SCr (W = 0, N = 3) • For sample sizes smaller than N=5 there are no possible values of W that would be significant at or beyond the baseline 0.05 level • CICM and SCr (W = 10, N = 9) • Level of Significance > 0.05 (Directional Test)
Conclusion • Structural Assessment of Product Lines can make use of Component Based Metrics • Adaptation requires consideration of PLA specific features, variability and optionality • Aggregated value as well as individual metrics are usefull for the architects • The metrics need to be validated further by studying industrial Product Lines
Future Work • Infuence towards overall quality • Degree of Relation • Unavailability of Product Line Architecture