Download
1 / 59
590 likes | 611 Vues
This article explores the four pillars of resilience and the importance of disaster preparedness in achieving disaster resilience. It discusses the technique of developing a disaster planning scenario and provides examples. The goal is to enable cities to be well prepared for future events and move from being unprepared to a state of preparedness for all natural hazards.

E N D
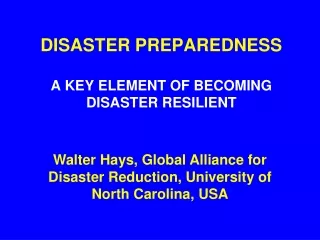
DISASTER PREPAREDNESSA KEY ELEMENT OF BECOMING DISASTER RESILIENT Walter Hays, Global Alliance for Disaster Reduction, University of North Carolina, USA
FOUR PILLARS OF RESILIENCE • EARTHQUAKES • INVENTORY • VULNERABILITY • LOCATION • PREPAREDNESS • PROTECTION • EMERGENCY RESPONSE • RECOVERY IENCE RISK ASSESSMENT ACCEPTABLE RISK RISK UNACCEPTABLE RISK GOAL: DISASTER RESILIENCE DATA BASES AND INFORMATION CITY HAZARDS: GROUND SHAKING GROUND FAILURE SURFACE FAULTING TECTONIC DEFORMATION TSUNAMI RUN UP AFTERSHOCKS
A FOCUS ONTHE TECHNIQUE OF DEVELOPING A DISASTER PLANNING SCENARIO EXAMPLES COMPLETED NEXT LECTURE
PURPOSE: Information from disaster scenarios will facilitate the adoption and implementation of policies and plans to enable a city to be well prepared for future events.
DISASTERS OCCUR WHEN---A CITY’S (COMMUNITY’S) PUBLIC POLICIES LEAVE IT … UN—PREPARED FOR THE INEVITABLE NATURAL HAZARDS
GLOBAL GOAL:FROM UN—PREPARED TO A STATE OF PREPAREDNESS FOR ALL CITIES AND ALL NATURAL HAZARDS
SUMMARY • A risk assessment is the probabilistic integration of: • The hazard (e.g., earthquakes) and their potential disaster agents (ground shaking, etc) and • The exposure, location and vulnerability of elements of the city’s built environment).
SUMMARY: HAZARD ENVIRONMENT • The parameters of the hazard environment control the primary disaster agents of ground shaking and ground failure and the secondary disaster agents of surface fault rupture, tsunami wave run up, seiche, regional tectonic deformation, and aftershocks.
SUMMARY: BUILT ENVIRONMENT • The built environment is comprised of buildings and infrastructure (the exposure, or the elements at risk), each having a relative vulnerability to a specific potential disaster agent such as ground shaking.
REQUIRED INFORMATION • Location of active faults. • Geometry of the faults. • Regional tectonic setting. • Spatial and temporal characteristics of seismicity
REQUIRED INFORMATION • Rate of decay of seismic energy with distance from the point of fault rupture. • Magnitude, other source parameters, and geologic structure.
REQUIRED INFORMATION • The physical properties of shallow, near-surface soils. • Construction materials of the exposure (buildings and infrastructure)
GROUND SHAKING • Ground shaking is characterized by two primary parameters: 1) the acceleration time history, and 2) its spectral acceleration. • Each varies as a function of magnitude, distance from the fault zone, and the properties of the local soil and rock column.
SESMIC SOURCES RECURRENCE ATTENUATION PROBABILITY CONSTRUCTING A PROBABILISTIC EARTHQUAKE HAZARD MAP
CONSTRUCTING A MAP • The first step is to choose one of the following parameters to map: • Intensity (Typically MMI values) • Peak ground acceleration (Typically PGA values) • Spectral acceleration (Typically 0.2 s period (short buildings) and/or 1.0 s period (tall buildings)
CONSTRUCTING A MAP • The second step is to choose an appropriate scale for the application and prepare a grid of points (e.g., 0.05 degree latitude and longitude)
CONSTRUCTING A MAP • The final steps are to add the layers of data, such as: • The geographic boundaries and cultural features of the community. • The fault systems. • The seismicity. • Seismic attenuation and soil
CALCULATIONS • Perform calculations for an exposure time (e.g., 50 or 100 years), and exceedance probability (e.g., 2 % or 10 %).
FROM A GROUND SHAKING MAP TO PUBLIC POLICY A map format facilitates dialogue on the best ways to form public policy for protecting the city’s essential facilities and critical infra-structure, another key element of disaster resilience.
35 30 25 UNREINFORCED MASONRY, BRICK OR STONE 20 REINFORCED CONCRETE WITH UNREINFORCED WALLS 15 10 REINFORCED CONCRETE WITH REINFORCEDWALLS STEEL FRAME ALL METAL 5 0 V VI VII VIII IX EXPECTED LOSS, VULNERABILTY, AND GROUND SHAKING MEAN DAMAGE RATIO, % OF REPLACEMENT VALUE INTENSITY
POLICY ENVIRONMENT • A city’s leaders make the decisions on what it will do to control and reduce its perceived risks (e.g., by adopting and implementing policies such as building codes, and lifeline standards to protect, and retrofit and rehabilitation to sustain).
RISK ASSESSMENT • The exposure (e.g., people, and elements of the community’s built environment) represent the TYPE and EXTENT of loss that is possible.
RISK ASSESSMENT (Continued) • The vulnerability (or fragility) of each element comprising the exposure affect nature and extent of damage and potential for collapse and loss of function.
RISK ASSESSMENT (Continued) • The location of each element of the exposure in relation to the hazard (ground shaking) affects the severity of shaking and potential damage.
RISK ASSESSMENT (continued) • The uncertainty in parameters that characterize the hazard and built environments affect decision making.
EARTHQUAKE DISASTER PLANNING SCENARIOS NOTE: TECHNIQUE THIS LECTURE; RESULTS NEXT LECTURE)
(SAN FRANCISCO BAY AREA): EARTH-QUAKE DISASTER PLANNING SCENARIO • WHERE WILL THE EARTHQUAKE OCCUR? • HOW BIG? HOW CLOSE? • HOW DEEP? WHEN? • THE DISASTER AGENTS? • VULNERABILITIES IN THE BUILT ENVIRONMENT? • EXPECTED DAMAGE? • EXPECTED SOCIO-ECONOMIC IMPACTS?
(LAS ANGELES AREA): EARTHQUAKE DISASTER PLANNING SCENARIO • WHERE WILL THE EARTHQUAKE OCCUR? • HOW BIG? HOW CLOSE? • HOW DEEP? WHEN? • THE DISASTER AGENTS? • VULNERABILITIES IN THE BUILT ENVIRONMENT? • EXPECTED DAMAGE? • EXPECTED SOCIO-ECONOMIC IMPACTS?
(SEATTLE, WA AREA): EARTHQUAKE DISASTER PLANNING SCENARIO • WHERE WILL THE EARTHQUAKE OCCUR? • WHEN? • HOW BIG? HOW CLOSE? • THE DISASTER AGENTS? • VULNERABILITIES IN THE BUILT ENVIRONMENT? • EXPECTED DAMAGE? • EXPECTED SOCIO-ECONOMIC IMPACTS?
(MEMPHIS, TN AREA): EARTHQUAKE DISASTER PLANNING SCENARIO • WHERE WILL THE EARTHQUAKE OCCUR? • HOW BIG? HOW CLOSE? • HOW DEEP? WHEN? • THE DISASTER AGENTS? • VULNERABILITIES IN THE BUILT ENVIRONMENT? • EXPECTED DAMAGE? • EXPECTED SOCIO-ECONOMIC IMPACTS?
(TOKYO, JAPAN AREA): EARTHQUAKE DISASTER PLANNING SCENARIO • WHERE WILL THE EARTHQUAKE OCCUR? • HOW BIG? HOW CLOSE? • HOW DEEP? WHEN? • THE DISASTER AGENTS? • VULNERABILITIES IN THE BUILT ENVIRONMENT? • EXPECTED DAMAGE? • EXPECTED SOCIO-ECONOMIC IMPACTS?
VULNERABILITY OF ELEMENTS • Note: Each element has a unique vulnerability (fragility) to earthquake ground shaking as the result of flaws that enter during the planning, siting, design, construction, use, and maintenance of individual buildings and elements of infrastructure.
VULNERABILITY • An element’s vulnerability is related to varying designs, ranging from non-engineered (e.g., a single-family dwelling) to engineered (e.g., a high-rise building).
VULNERABILITY • Vulnerability is related to varying ages of construction, which also means varying editions of the building code and its seismic design provisions.
VULNERABILITY • Vulnerability is related to varying construction materials (e.g., wood, un-reinforced masonry, un-reinforced concrete, reinforced concrete, light metal, and steel).
VULNERABILITY • Vulnerability is related to the design for varying service lives (e.g., 30 years for the half-life of a class of houses; 40 years for a class of bridges, etc.).
VULNERABILITY • Vulnerability is related to varying configurations(i.e., elevations and floor plans). • NOTE: The greater the vulner-ability the higher the potential for the building to collapse)
CONFIGURATION VULNERABILITY BUILDING ELEVATION LOCATIONS OF POTENTIAL FAILURE RELATIVE VULERABILITY [1 (Best) to 10 (Worst)] None, if attention given to foundation and non structural elements. Rocking may crack foundation and structure. 1-2 Box
CONFIGURATION VULNERABILITY BUILDING ELEVATION LOCATIONS OF POTENTIAL FAILURE RELATIVE VULERABILITY [1 (Best) to 10 (Worst)] Top heavy, asymmetrical structure may fail at foundation due to rocking and overturning. 4 - 6 Inverted Pyramid
CONFIGURATION VULNERABILITY BUILDING ELEVATION LOCATIONS OF POTENTIAL FAILURE RELATIVE VULERABILITY [1 (Best) to 10 (Worst)] CONFIGURATION Vertical transition in mass, stiffness, and damping may cause failure at foundation and transition points at each floor. 2 - 3 Multiple Setbacks
CONFIGURATION VULNERABILITY BUILDING ELEVATION LOCATIONS OF POTENTIAL FAILURE RELATIVE VULERABILITY [1 (Best) to 10 (Worst)] Asymmetry and horizontal transition in mass, stiffness and damping may cause failure where lower and upper structures join. 5 - 6 “L”- Shaped Building
CONFIGURATION VULNERABILITY BUILDING ELEVATION LOCATIONS OF POTENTIAL FAILURE RELATIVE VULERABILITY [1 (Best) to 10 (Worst)] Vertical transition and asymmetry may cause failure where lower part is attached to tower. 3 - 5 Inverted “T”