www.forex2tradeindia.weebly.com
120 likes | 965 Vues
Vol.3. Trade with < CHARTS >. ven KEY pra WIN SURE sh. TECHNICAL Analysis. www.forex2tradeindia.weebly.com. Confirmations & Indicators. Trading Friends Trend Advisors. Dynamic Subject. Logical Thinking towards Price Action. INDIA. forex2tradeindia.

www.forex2tradeindia.weebly.com
E N D
Presentation Transcript
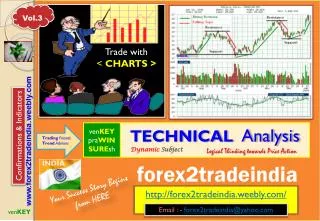
Vol.3 Trade with < CHARTS > venKEY praWIN SUREsh TECHNICAL Analysis www.forex2tradeindia.weebly.com Confirmations & Indicators TradingFriends Trend Advisors Dynamic Subject LogicalThinkingtowards Price Action INDIA forex2tradeindia Your Success Story Begins from HERE http://forex2tradeindia.weebly.com/ Email : - forex2tradeindia@yahoo.com venKEY
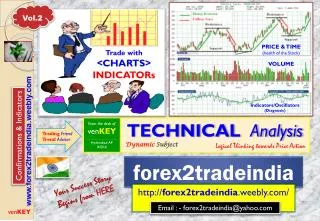
Finding Price Action & Confirmation Technical Analysis - INDICATORS Vol.3 Indicators/Oscillators • 3.Oscillators/Indicators • (Confirmation) • RSI • Stochastic • MACD • William % • CCI, ADL • Works in • . CHOPPY trend • . Within the TREND where no Volumes • Not works : • When trend with Volumes • Break-out/Break-down • When patterns forming on Chart NOTE Do not trade with oscillators even it given more times profit. Never expect Oscillators give more PROFIT www.forex2tradeindia.weebly.com Confirmations & Indicators Oscillators helps trader to catch the MOMENTUM within the TREND + Overbought & Oversold conditions venKEY
With in the Trend – intra NOISE Over Bought & Over Sold OVER BOUGHT - It is a territory (stage) of a market where market suffering from fresh inflow of the liquidity. Especially crowds bought shares beyond their capacities and market becomes over leveraged by the weak participants of the market. Due to lack of fresh inflows, price unable to sustain in the top and price starts falling. Here valuation of stock is highly expensive. Over leverage of weak participants leads - Over Bought - Over Sold It is very common in the Market as Brokers and Exchanges provides High leverage as the market itself MARGIN trading…. Greedy and Speculators bet the Price action at this stages. OVERSOLD – It is a territory (state) of a market where market fresh inflow of the liquidity. Especially crowds sell shares beyond their capacities and market becomes over leveraged by the weak participants of the market. Due to fresh inflows, price starts rising. Here valuation of stock looks cheap and attractive. www.forex2tradeindia.weebly.com Confirmations & Indicators Symptoms - Price frequently creates equal or similar Highs & Lows. - The price will not break established HIGH/LOW of defined time frame - Bollinger Bonds are very closer than earlier - Moving Averages are close to each other & will not cross - Probable Horizontal Channels appear • Identifying Indicators • RSI- Relative Strength Indicator • Stochastics • ADX (Trend Strength) Trade only when diverting from its zone venKEY
RSI - technical momentum indicator Compares the magnitude of recent gains to recent losses to determine overbought (>70-100) and oversold (0-<30) conditions of Stock at a Particular PRICE & time. ……………………………………….. formula: RSI = 100 - 100/(1 + RS*) RS* = Average of x days' up closes / Average of x days' down closes. RSI –Relative Strength Index Wales Walder(1974) Over bought zone (>70) RSI RSI Overbought & Oversold Signals These assume a 14-period look back on the RSI and a 10-day intraday price chart. If you have access to tools that you can change the 14-period look back, try tuning it for your market. Locate regions of support and resistance and see if changing the 14-period look back to another value will give you better turning point prediction. You are looking for signals that help you time the move from support to resistance and back again. Perhaps you want to use different signal lines than 30 and 70 (like 20 and 80). Play with it. See if you can get RSI to signal when it hits or approaches support or resistance zones. Find your buy or sell candidate in the usual manner, following rules and procedures you have already setup. Plot the RSI indicator. For example, if you see price topping out, high volume accompanies the turn, and RSI says the stock is overbought, that's a sell signal. If RSI is above 70, then wait for it to drop below 70 before trading. Close out a long trade, go short, or buy a put option. Large price declines often start from the overbought region. High volume can confirm the trend change. If RSI is below 30, then wait for it to rise above 30 before trading. Then buy, cover a short, or buy a call option. Large price advances often start from the oversold region. High volume can confirm the trend change. If RSI is midrange, then ignore the signal. Oversold Zone (<30) www.forex2tradeindia.weebly.com Confirmations & Indicators • Best combinations • RSI + ADX + Parabolic SAR venKEY
George C. Lane – late 1950s,) Stochastics-1 Stochastic Oscillator is a momentum indicator - shows the location of the close relative to the high-low range over a set number of periods Stochastic Oscillator "doesn't follow price, it doesn't follow volume or anything like that. It follows the speed or the momentum of price. As a rule, the momentum changes direction before price." As such, bullish and bearish divergences in the Stochastic Oscillator can be used to foreshadow reversals. Stochastics used for: 1) To Identify Bulls & Bears setups to anticipate a future reversal 2) Useful in Identifying “Overbought & Oversold” Levels Interpretation Assume that the highest high equals 110, the lowest low equals 100 and the close equals 108. The high-low range is 10, which is the denominator in the %K formula. The close less the lowest low equals 8, which is the numerator. 8 divided by 10 equals .80 or 80%. Multiply this number by 100 to find %K %K would equal 30 if the close was at 103 (.30 x 100). The Stochastic Oscillator is above 50 when the close is in the upper half of the range and below 50 when the close is in the lower half. Low readings (below 20) indicate that price is near its low for the given time period. High readings (above 80) indicate that price is near its high for the given time period. CALCULATIONS :%K = (Current Close - Lowest Low)/(Highest High - Lowest Low) * 100 %D = 3-day SMA of %K Lowest Low = lowest low for the look-back period Highest High = highest high for the look-back period %K is multiplied by 100 to move the decimal point two places www.forex2tradeindia.weebly.com Confirmations & Indicators Default Settings : The default setting for the Stochastic Oscillator is 14 periods, which can be days, weeks, months or an intraday timeframe. A 14-period %K would use the most recent close, the highest high over the last 14 periods and the lowest low over the last 14 periods. %D is a 3-day simple moving average of %K. This line is plotted alongside %K to act as a signal or trigger line. http://stockcharts.com/school/doku.php?id=chart_school:technical_indicators:moving_average_conve venKEY
Stochastics-2 www.forex2tradeindia.weebly.com Confirmations & Indicators Fast Stochastic Oscillator: Fast %K = %K basic calculation Fast %D = 3-period SMA of Fast %K Slow Stochastic Oscillator: Slow %K = Fast %K smoothed with 3-period SMA Slow %D = 3-period SMA of Slow %K Full Stochastic Oscillator: Full %K = Fast %K smoothed with X-period SMA Full %D = X-period SMA of Full %K The Full Stochastic Oscillator is a fully customizable version of the Slow Stochastic Oscillator. Users can set the look-back period, the number of periods to slow %K and the number of periods for the %D moving average. http://stockcharts.com/school/doku.php?id=chart_school:technical_indicators:moving_average_conve venKEY
MACD Moving Average Convergence & Divergence Developed by Gerald Appel. Calculation : MACD: (12-day EMA - 26-day EMA) Signal Line: 9-day EMA of MACD MACD Histogram: MACD - Signal Line Trading MACD fluctuates above/below “ZERO” Buy>/sell < : ZERO-Line / cross overs MACD is one of the simplest /most effective/Worlds best trend following momentum indicators available. MACD turns two trend-following indicators, moving averages, into a momentum oscillator by subtracting the longer moving average from the shorter moving average. ( ie. Substcract 12 DMA from 26 DMA) MACD fluctuates above & below the zero line as the moving averages converge, cross and diverge. Traders can look for signal line crossovers, centerline crossovers and divergences to generate signals. Because MACD is unbounded, it is not particularly useful for identifying overbought and oversold levels www.forex2tradeindia.weebly.com Confirmations & Indicators http://stockcharts.com/school/doku.php?id=chart_school:technical_indicators:moving_average_conve venKEY Combinations : MACD + RSI+ Moving Averages
CCI www.forex2tradeindia.weebly.com Confirmations & Indicators http://stockcharts.com/school/doku.php?id=chart_school:technical_indicators:moving_average_conve venKEY
William R % www.forex2tradeindia.weebly.com Confirmations & Indicators http://stockcharts.com/school/doku.php?id=chart_school:technical_indicators:moving_average_conve venKEY
OBV www.forex2tradeindia.weebly.com Confirmations & Indicators http://stockcharts.com/school/doku.php?id=chart_school:technical_indicators:moving_average_conve venKEY