Download
1 / 15
150 likes | 292 Vues
This work delves into matrix approaches within macroecology, focusing on food webs such as the Nepenthes albomarginata, revealing vital connectance and chain metrics. It examines species associations through biogeographic matrices, utilizing metrics like C-score, clumping-score, and togetherness-score to assess spatial turnover and niche overlap. Moreover, it discusses the measurement of nestedness, species aggregation, and introduces software tools for advanced ecological network analysis. This comprehensive analysis provides insights into connectivity, turnover, and the structure of ecological communities.

E N D
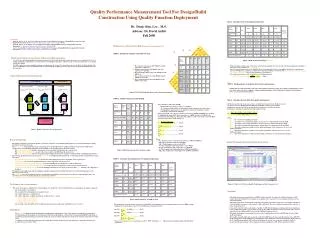
Community and gradient analysis: Matrix approaches in macroecology The world comes in fragments
Basic metrics of food webs A pitcher plant (Nepenthes albomarginata) food web Nepenthes albomarginata S = 19 species Lmax = 19*18/2 = 171 possible links between two species L = 35 realized links between two species Connectance: C = 35/171 Ch = 100 total length of all food chains Li = 40 is the total number of chains ChL = 100/40 = 2.5 is the average chain length L/S = 35/19 = 1.8 is the mean number of links per species
Food web metrics translated into matrix metrics N = 28 Fill = 28/80=0.35 Dm=28/10=2.8 Dn=28/8=3.5
Metrics of species associations in biogeographic matrices The C-score as a metric of negative associations Checkerboards The Clumping-score as a metric of positive associations The Togetherness-score as a metric of niche overlap
The additive nature of the C-score Numbers of checkerboards for entries within the area AT are a measure of spatial species turnover. Numbers of checkerboards for entries within the area ATC are a measure of turnover independent species segregation. CMixed = CS – CTurn - CSegr. The rank correlation of matrix entries is a metric of spatial turnover. • 11 21 32 12 2…….7 108 10 R2 is a more liberal metric than Cturn. R2 = 0.347 The correlation of ordination scores is also a metric of turnover but even less selective.
Range size coherence Coherent range size Scattered range size There are 17 embedded absences. The number of embedded absences is a measure of species range size coherence. The metric depends strongly on the ordering of rows and columns
The measurement of nestedness The distance concept of nestedness. Sort the matrix rows and olumns according to some gradient. Define an isocline that divides the matrix into a perfectly filled and an empty part. The normalized squared sum of relative distances of unexpected absences and unexpected presences is now a metric of nestednessis.
Nestedness based on Overlap and Decreasing Fill (NODF) NODF is a gap based metric and more conservative than temperature.
The disorder measure of Brualdi and Sanderson Ho many cells must be filled or emptied to achieve a perfectly ordered matrix. The Brualdi Sanderson measure is a count of this number Discrepancy is a gap counting metric.
How to measure species aggregation? dij Nearest neighbor metrics Nearest neighbour is a presence – absence metric Compartmented matrix NND has weak power at higher matrix fill Join count statistics Other metrics proposed: Morisita Simpson Soerensen Block variance Ordination score variance Marginal variances A sum of cell entries around a focal cell multiplied by the entry of the focal cell Join count operates on presence – absence and abundance matrices These metrics have very low power a moderate to small matrix size and high or low matrix fill.
Abundance based metrics The C-score extension The metric CA is a count of the number of abundance checkerboards in the matrix. Other 2x2 submatrices catch matrix properties that have not well defined ecological meaning.
Nestedness in abundance matrices The metric is a sum of all pairs in the matrix (first sorted accoding to species richness then sorted according to weights), where the weight in the row/column of lower species richness is smaller than the weight in the row/column of higher species richness
Pattern detection in large matrices Pajek: software for social network analysis WAND: ecological network analysis These programs use cluster analysis and ordination to sort the matrix according to numbers of occurrences. Didstance metrics are then used to identify compartments. They generate hypotheses about matrix structure. They do not fully allow for statistical inference. KliqueFinder: software for compartment analysis