Download
1 / 10
100 likes | 254 Vues
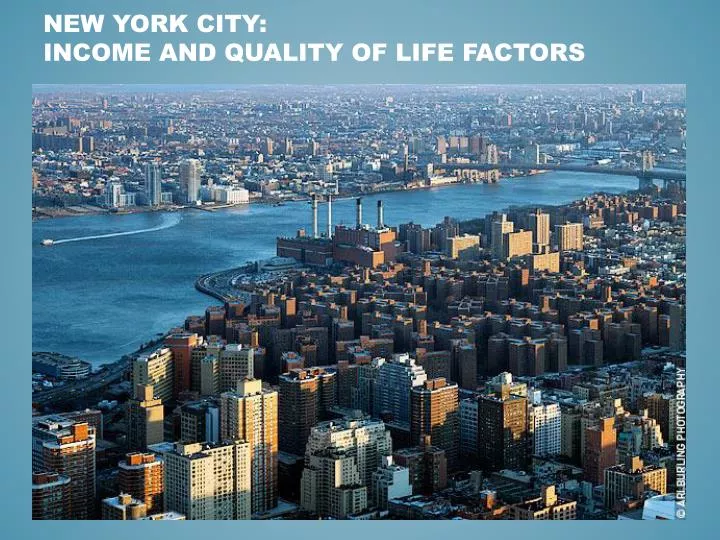
New York City: Income and quality of life factors. New York City is one of the best, if not the best city in the world. There are cultural institutions and landmarks that rival those that are many centuries older.

E N D
New York City is one of the best, if not the best city in the world. There are cultural institutions and landmarks that rival those that are many centuries older. With a population of 8.2 million people, the city draws people from all walks of life and is a hub of diversity and creativity.
Demand for housing in NYC is very intense and a good apartment is difficult to find. There are longstanding policies in place by entities like the NY Housing Authority that sustains rent-controlled apartment despite their large inefficiencies. After reading a good amount of literature on the history of public housing in the city, I decided to investigate New Yorkers’ median incomes and how much they spent on housing. I also wanted to see where lower-income families lived and look for quality of life factors in close proximity to their homes.
Source: U.S. Census Bureau, 2006-2010 American Community Survey
Tracts with highest per capita incomeTract 142: 4,462 pop. [2010]Between 5th Park Ave at 84th and 77th StTract 130: 4,195 pop. [2010] Just South of Tract 143 btwn 77th & 70th StTract 112.02: 441 POP. [2010]btwn 5th and park ave at 59th & 56thTract 21: 6,040 Pop. [2010]btwnwestsidehwy and broadway at reade & Vesey St.
Tracts with Lowest Per capita incomeTract 267: 2,173 pop. [2010]; Washington Heightsbtwn 188th & Washington BridgeTract 243.02: 7,370 pop. [2010]; Harlembtwnharlem river dr. & 155thstTract 240: 1,648 pop. [2010]; randall’s islandTract 20: 4,917 pop. [2010]; Lower east sidebtwnave D & east river at 6thst & Houston
U.S. Census Bureau, 2006-2010 American Community Survey
Source: Social Explorer Tables: ACS 2006 to 2010 (5-Year Estimates)
Source: Social Explorer Tables: ACS 2006 to 2010 (5-Year Estimates)
Further Analysis: Further study would involve looking more closely at income and taxes paid by both the wealthy and the poor. It was recently reported that optimal income is $75,000 for indicators of happiness. I plan on obtaining some data from the PLUTO dataset from the NY Department of Planning. Studying quality of life measures is difficult but not impossible; psychologists and statisticians perform this sort of research. It would be interesting to see what sort of programs that both wealthy and lower income families participate in in NYC and if some of those programs are supported by the city of NY. I plan on mapping cultural locations and access to these areas. One of the biggest quality of life decreases is a long commute. In NYC, public transportation is easily accessible. I can expand my profile of New Yorkers to include people in the boroughs who often experience longer commute times. I would have to spend additional time looking at evidence on how to appropriately measure quality of life variables.