Business Analytics at TVS Motors
910 likes | 1.79k Vues
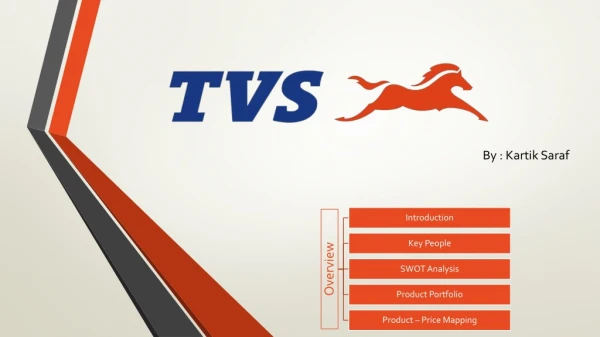
Business Analytics at TVS Motors. Agenda. Group introduction Why BI BI journey at TVS Motors. Group profile. Wabco TVS Three manufacturing Units. Group profile. Products-Motorcycle Sold 7 million till March 2010. TVS JIVE. TVS StaR Sport. TVS StaR City. TVS Flame. TVS Apache RTR.

Business Analytics at TVS Motors
E N D
Presentation Transcript
Agenda • Group introduction • Why BI • BI journey at TVS Motors
Group profile • Wabco TVS • Three manufacturing Units
Products-Motorcycle Sold 7 million till March 2010 TVS JIVE TVS StaR Sport TVS StaR City TVS Flame TVS Apache RTR
Products-Scooter Sold 2.3 million till March 2010 TVS Wego TVS Scooty Pep+ TVS Wego TVS Scooty Streak
Products – Mopeds Sold 6.2 million till March 2009 TVS XL SUPER TVS XL SUPER HD
Evolution of IT in TVS Motor • Upgrade to ECC 6.0 • Business benefit - 6 times of IT establishment cost • Enterprise portal • Web 2.0 Web 2.0 PMS Digitized dashboard PLM SAP EP 2008-10 XI, SOLMAN, Sales on SMS 2007 2006 • SAP BW / HR PAYROLL • SAP in group companies 2005 2001 DMS/CRM 2004 2003 Intranet SAP R3 2002
Simplicity is height of Sophistication No training required for ATM and e-mails
Critical Success Factors Speed Look and feel Ease of Use Insights
What is Business Intelligence ? People - Passive information receiver to proactive information seekers and IT from “transaction automation tool” to “IT as a Transformation Platform for Business Innovation and Best in Class Operational Efficiency “
Business Intelligence is an Analytical tool Reporting tool A Decision support tool A common platform and not restricted to any particular application
NEED FOR BI SAP data – Complex reporting req Dealership Data from dealers CRM info Dashboards for each user. Avoid person dependent Reporting
Functionalities reqd. in BI Reporting Broadcasting Analytics Alerts Spend Analysis
BI Journey at TVSM • Implemented BIW 3.0 in 2004 • Sales and Production modules implemented • Solution not user friendly and not used widely
BI Journey at TVSM • Upgrade to BI.7.0 in 2007 • SAP- Sales , Production • Non SAP –DMS(Oracle) and MSSQL data integration • CRM Data • BeX Reports developed
BI –Journey cont.. Adoption of Web Application Designer to make reports more user friendly BI analytics – Clustering of Customer data to understanding the customer usage pattern.
BI –Journey Cont.. • Implementation of Enterprise Portal • Personalized dashboard for All Employees • Completed for sales staff
How BI works ?? Data captured, compiled and stored in all the above mentioned various sources are Integrated Centrally stored Analyzed Provides output in the required format
For Whom BI will be useful ? For Sr. Managers (Macro level reports) For Business Managers and Decision makers (Micro level and Ad-hoc reports)
When we need BI ? “One can’t predict the need – any time for any informed business decision”
Where the BI can be accessed ? It can be used thro Internet….. At any time At any where At any place
Advantages of BI Data access at any place Updated and accurate data Graphical view of information Trend analysis with colour codification Direct export to excel Reduce dependency on paper reports Easy for transmission thro mail Centralized data storage
Vehicle Sales Dashboard • Top 20 dealers • Bottom 20 Dealers • Model - wise sales • Zero Billing dealers
Inventory Not in BOM and No plan Excess to the maximum Norm With in Maximum Norm
Inventory Not in BOM and No plan Excess to the maximum Norm With in Maximum Norm
Inventory dashboard Business Objectives: • To reduce inventory by Rs.100 crores in 4 months • To improve free cash flow • Solution • Classification of inventory as follows • Qty & Value as per norms - GREEN • Qty & value above norms but usable for existing products – GREY • Items not required for the current production plan – RED • - Dashboard developed in SAP BI with facility to drill down upto part / buyer • Key Benefits • Inventory reduced by Rs.100 crores • Better inventory maintenance Business Issues: - Due to recession, conserving cash very important - Non availability of a dashboard to identify to identify low hanging fruits 47