Organic Soil Management
Organic Soil Management. Elsa Sanchez Brian Caldwell. Outline. What are the farmers goals/needs for their soil? (Brian and Elsa) 5 min Nutrient building (Elsa) 20 min Soil tests and recommendations (Brian and Elsa) 5 min Nutrients and weeds (Brian) 10 min

Organic Soil Management
E N D
Presentation Transcript
Organic Soil Management Elsa Sanchez Brian Caldwell
Outline • What are the farmers goals/needs for their soil? (Brian and Elsa) 5 min • Nutrient building (Elsa) 20 min • Soil tests and recommendations (Brian and Elsa) 5 min • Nutrients and weeds (Brian) 10 min • N from cover crops/green manures (Brian) 10 min • Case studies (Brian and Elsa) 10 min
Farmer Goals/Needs for their Soil • Production • Sustainability (physical, biological, economic) • Reduce off farm pollution • Also--??
Compost • Difficulty using conventional soil tests • Excess nutrients – P, K, Mg, Ca – but many didn’t realize it • Compost applied based on amount on hand vs. calculating • Compost generally not analyzed prior to use
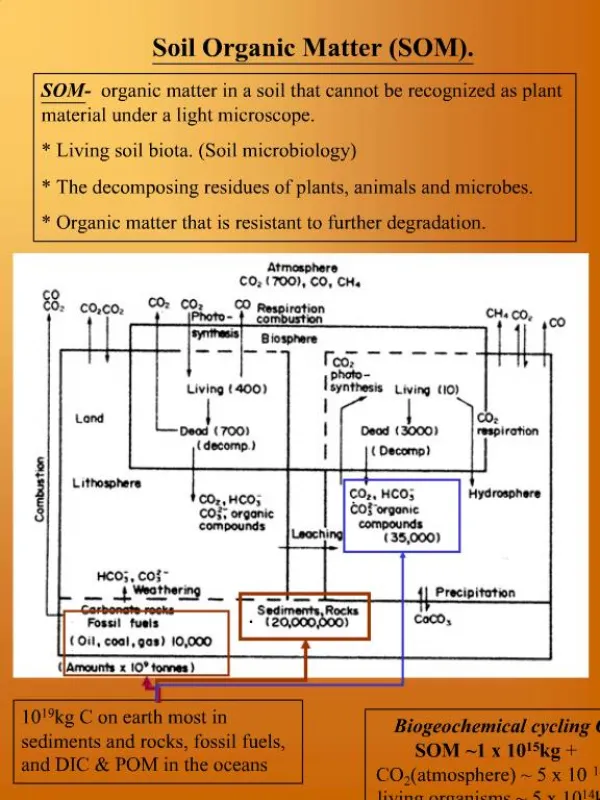
Other Support Case study of 11 organic farms: Those relying on compost, often had surplus nutrients, as much as about 160 – 182 lbs P & N/acre/yr excess. Drinkwater et al., 2005 West Virginia organic research fields had begun to saturate soil nutrient holding capacity; decided to “restrict compost applications to crops with maximum yield response.” Kotcon, 2004 Over 2 years, Morris et al., (2004) sampled 30 farms, found on average: 42% had above optimum P levels, 20% below optimum.
Challenges Using Compost • Compost, manures, other organic amendments & green manures slowly release nutrients • When & how much to apply challenging • Nutrient availability often unpredictable – especially nitrogen • When & how much to apply challenging
Mineralization • Breakdown of organic nutrient sources • Conversion to inorganic, plant available forms • Rate and timing of mineralization depends on many variables • Soil temperature • Soil moisture • Incorporation/depth of incorporation • Soil microorganisms • Carbon to nitrogen ratio • Particle size • 10-50% a year
Mineralization Process Who does the work of mineralization? • Fungi, bacteria, yeasts, actinomycetes, some small critters (nematodes, rotoifers) • Nitrogen temporarily tied up by microbes
C:N Ratios • Ratio of carbon to nitrogen in a material • C:N ratios decrease as organic material decomposes (CO2 given off, nitrogen incorporated into fungi & bacteria) • C:N ratio & nitrogen availability • > 30:1; nitrogen tied-up by microorganisms • < 20:1; nitrogen release
Nutrient Build Up in Soils • Because mineralization unpredictable & uncontrollable: • Nutrients released at times when plant need is not high resulting in build up of nutrients & salts in soil • Organic nutrient sources are often over applied to insure nitrogen available for good crop yields
Nutrient Build Up • Also, organic nutrient sources often contain more than one nutrient, not in balance with crop needs resulting in surpluses • Compost 1 – 0.7 – 1 • Applied 12.5 tons/acre • 250 lbs nitrogen; 175 lbs P2O5; 250 lbs K2O
Exceeds Crop Needs Deficient Calcium Phosphate Magnesium Potash
Compost Use for High Tunnel Bell Peppers • 10-wk-old ‘Paladin’ in 2000, ‘King Arthur’ in 2001 transplanted late May • 4 Raised beds per tunnel; 18” in row spacing • Drip irrigation • Harvest mid July – late Oct. • Pests: weeds – hand weeded; aphids – lady-bird beetles
Compost Treatments • Compost – dairy manure based • 3 treatments compost applied at 1” or 2” depth, incorporated 12”; inorganic fertilizer at a rate of 75-150-75
Nutrient Recommendations • Clay-loam soil, nutrients in optimum range • Nitrogen – 100 lb/acre • Phosphate – 150 lb/acre • Potash – 100 lb/acre
Beginning Soil Analysis Soil Property lb/acre P2O5 174 ± 44 K2O 383 ± 66 CaO 3862 ± 565 MgO 356 ± 63 pH 6.7 ± 0.2 Organic matter (%) 2.4 ± 0.3 Soluble salts (mmhos/cm) 0.15 ± 0.03
Compost Properties Soil Property lb/ton FW N 33 P2O5 15 K2O 17 Ca 117 Mg 28 pH 8 C:N 12 Soluble salts (mmhos/cm) 5.1
Available Nutrients Added lb/acre Fertilizer 1” 2” Nitrogen 75 441* 883* Phosphate 150 1345 2683 Potash 75 1559 3118 Calcium 010570 21147 Magnesium0 2555 5110 *using a 15% mineralization rate
Nutrient Summary • Nitrogen • 1” compost = 4.5x more than 100 lbs/a • 2” compost = 9x more • Phosphate • 1” compost + soil = 10x more than 150 lbs/a • 2” compost + soil = 19x • Potash • 1” compost + soil = 13x more than 100 lbs/a • 2” compost + soil = 35x
Marketable Pepper Yield 2000 2001 Treatment lb/ft2 Fertilizer 2.1 3.3 1” Compost 2.4 3.3 2” Compost 1.4 2.9
Soil Properties After Harvest Fertilizer 1” Compost 2” Compost 2000 pH 6.4 7.37.4 OM (%) 2.54.8 6.6 Salts (mmhos/cm) 0.140.45 0.81 2001 pH 6.87.3 7.3 OM (%) 2.34.76.6 Salts (mmhos/cm) 0.300.951.9
Conclusions • Possible salt injury led to lower yields • 0.40 or 1.5 mmho/cm threshold for peppers • Above threshold 16-50% yield reduction • Exclude precipitation and drip irrigation • Leaching reduced; can lead to build up of salts
Using Compost • Nutrient content varies; recommend tested to determine amount of nutrients • Apply nutrients based on plant needs vs. volume • Leaching in soil or compost - remove plastic, sprinkler irrigation
Problems with Over-Application • Loss profits due to cost of over-applied organic nutrient sources • Indirect losses from decreased yields associated with high salt or nutrient levels in soil & weed competition • Pollution of surface & groundwater
How to Avoid Over Application • Soil testing • Analyze compost • Calculate how much to apply • Use variety of nutrient sources • Avoid continuous use of any single organic nutrient source with more than 1 nutrient
3 Composts Soil Property Compost 1 23 Organic N (%) 1.1 1.2 0.7 NH4+-N (lb/ton) 1.6 1.5 0.0 Phosphate (%) 0.5 0.8 0.2 Potash (%) 0.8 1.8 0.4 pH 7.4 6.9 7.5 C:N 12.1 13.2 14.7 Soluble salts 5.5 14.1 0.8 (mmhos/cm)
75 lb/acre N • Compost 1 • 12.5 tons/acre (55 lbs organic N + 20 lbs ammonium-N) • Compost 2 • 12 tons/acre • Compost 3 • 27 tons/acre
How to Avoid Over Application • For organic nutrient sources with more than 1 nutrient • Use only when soil P, K levels not above optimum (exception, P in cold soils) • If P, K levels high, use legume cover crops, nitrogen fertilizers with no or low levels of P & K • Always incorporate to minimize runoff & erosion losses
When Nutrient Levels are High • Soil testing to monitor levels • Nitrogen supply – use N sources with no or minimal levels of other nutrients • Legume cover crops, other nutrient sources • Calculate residual nitrogen to determine how much is needed • Plant cover crop, reduce tillage, use grass waterways to minimize erosion, runoff losses
Soil tests and recommendations • Variety of tests and philosophies • Early years—more intensive sampling • After about 5 years—sampling to monitor the fertility program, every 2-3 years
Nutrients and Weeds • Recent research results
Do organic nutrient amendments promote weed problems? Chuck Mohler Cornell University
The problem • Most livestock farms and organic farms use compost and manure as primary nutrient sources • Correct application rates are difficult to determine • Nutrients released slowly over time • Concentration varies • Farmers often err on the high side to insure adequate nutrients for crop growth • Enough to supply N needs usually applies excess P and K
Weed height did not reach a maximum as rate increased Giant foxtail Lambsquarters Common ragweed
Cornell Organic Cropping Systems: Grain Experiment • Initiated 2005 • 3-year rotation: soybean spelt/(red clover) corn • 5 Systems • “High” nutrient • Low input • Intensive weed management • Reduced tillage • Chemical
a a b b b
Which nutrient is limiting for the weeds? • The answer determines the management strategy. • 2010 Experiment • Alfalfa/clover plow down on low K, low P soil
Pigweed Control Pigweed biomass Pigweed with highest “N-P-K” treatment Pigweed with highest rate of compost
Corn at highest compost rate Corn Control
0X 1X 2X 4X 8X Error bars are standard error.
Balancing Cover Crops and Tillage • Tillage destroys soil organic matter • How to balance planting a cover crop which may require extra tillage? • Get the most out of it
Spring Oats and Peas • Plant as early as possible • Terminate in early July before fall-planted brassicas • Good biomass production • 5000 lb/acre peas ~ 150 lb/acre N • Good weed suppression
Summer Oats and Peas • Plant before 8/15 • Allow to winter kill • Moderate biomass production • 3000 lb/acre peas ~ 100 lb/acre N • Good weed suppression
Red Clover • Production of 1000-4000 lb/acre of dry biomass in the fall • Plus 2500-5000 lb/acre by plowdown (mid May) the following spring • Roots are substantial as well • Adequate N for 160 bu/acre corn on a strong soil
Hairy Vetch—Early Fall • Planting date not critical if before 9/15 • Can plant with a grass companion crop • 5000 lb/acre biomass ~ 150+ lb/acre N
Hairy Vetch • Termination date makes a large difference • Fair weed suppression