Download
1 / 2
20 likes | 216 Vues
2011 EGU General Assembly. 3 – 8 th April 2011, Vienna – Poster G3-3901. GPS Positioning Performance from Algorithm Advances in the Network Version of OPUS. Neil D. Weston and Jim R. Ray, National Geodetic Survey, NOAA.

E N D
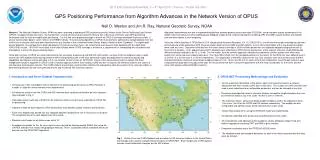
2011 EGU General Assembly. 3 – 8th April 2011, Vienna – Poster G3-3901 GPS Positioning Performance from Algorithm Advances in the Network Version of OPUS Neil D. Weston and Jim R. Ray, National Geodetic Survey, NOAA Abstract The National Geodetic Survey, NOAA has been operating a web-based GPS positioning service, known as the Online Positioning User Service (OPUS), for approximately ten years. During that time, several versions have evolved to reflect a few of the most commonly used GPS positioning techniques such as static and rapid static positioning. Our first and most popular prototype is known as OPUS-S and was developed to process static L1 and L2 carrier-phase data in native receiver and RINEX formats. The processing algorithms of OPUS-S are primarily optimized to accept datasets from two to 48 hours in duration that have been observed from any location in the continental United States, Alaska, Hawaii and the Caribbean. For significantly shorter datasets, for example those observed between 15 minutes and two hours, we recommend users process their datasets with the rapid static (OPUS-RS) version. OPUS-RS works best in the United States where CORS coverage is extensive, a requirement for interpolating the ionosphere and troposphere in one of the pre-processing stages. Since both versions of OPUS are used extensively by the surveying, engineering and GIS/LIS communities, our goal of this investigation was to retain most of the GPS dataset observing requirements while incorporating some of the most advanced models and algorithms to extend the positioning capabilities and improve overall accuracy in the new network version known as OPUS-Net. Some of the improvements were to replace the three independent solutions algorithm in OPUS-S with a network approach where three nearby CORS and the 10 closest IGS reference stations are used in a simultaneous least squares solution. The CORS stations are primarily used to better estimate the troposphere while the position of the unknown station is determined primarily from the more precisely known and monitored IGS reference stations. Additional improvements are due to implementing absolute antenna patterns and ocean tides (FES2004), using reference station coordinates in the IGS05 reference frame as well as adding phase ambiguity integer fixing, relative troposphere modeling (GPT and GMF a priori models) and satellite and reference station a priori weighting. Since the initial evaluation of OPUS-Net in 2010 (Geophysical Research Abstracts, Vol. 12, EGU2010-0), a much more thorough investigation has been performed and will be presented. GPS reference station data from 94 CORS and IGS stations, most in the United States with a few around the globe, were used as rovers. Data were collected from the rovers every fourth day in 2009 and then parsed into four separate datasets ranging from one to four hours in duration. In all, approximately 24717 datasets were submitted to OPUS-Net for processing. Initial analysis show the mean RMS double difference phase residuals to be 12 ± 3 mm. The low scatter from the network approach indicates homogeneous solution quality even when data quality from some reference stations were poor. The mean NEU offsets from the accepted positions of the rovers for the 5970 one hour datasets were 0 ± 54 mm, 6 ± 52 mm and -4 ± 45 mm respectively. The magnitudes of the NEU offsets for the four hour solutions were very similar except that the standard deviations improved (decreased) to approximately 21 mm, 18 mm and 24 mm for each of the three components. Even though solutions were computed from data taken throughout the year, the results show that there is excellent agreement with the mean coordinates for the rovers and the mean IGS weekly combined SINEX solutions. 1. Introduction and Rover Dataset Characteristics 2. OPUS-NET Processing Methodology and Evaluation • For the experiment described in this poster, each rover was processed in a network • adjustment with three nearby CORS and 10 IGS sites. The number of CORS and IGS sites • used in each adjustment are configurable parameters and can be changed at run time. • The processing algorithm selects reference stations so baseline lengths between the rover • and reference stations vary from under 100 Km to over a 1000 Km. • The reference station apriori coordinate weight multipliers used in the adjustment were • 1.0e-4 and 1.0e+3 for the CORS and IGS stations respectively. The weights are also • configurable and optimal values will be determined in a later study. • Ocean tides loading (OTL) using the FES2004 model was implemented. • All datasets submitted were processed using IGS precise (final) orbits. • All computations used absolute antenna patterns, phase ambiguity integer fixing and • relative troposphere modeling (GPT and GMF a priori models). • Computed coordinates are in the ITRF2005 (IGS05) frame. • The weighted mean and standard deviations for each rover were computed after the data • were de-trended. BRTW • The purpose of this investigation was to determine the positioning performance of OPUS-Net after a • number of algorithm enhancements were implemented. • 94 reference stations from the CORS and IGS networks were randomly selected to be rover datasets • (blue triangles in Fig. 1). • Data taken every fourth day of 2009 from 94 reference stations (rovers) were submitted to OPUS-Net • for processing. • Datasets contained dual-frequency GPS observations from geodetic quality receivers and antennas. • Each rover dataset was parsed into four separate datasets ranging from one to fours hours in duration. • The sampling interval for each dataset was 30 seconds. • Elevation cutoff angle for all stations was set at 10˚. • Accepted coordinates for the 94 rover stations were derived by stacking weekly SINEX files using the • CATREF software from Institut Géographique National. These coordinates will be compared with those • derived from the OPUS-NET algorithms. WACH OKCB PBCH NAPL MIA3 KWST Fig. 1. Stations from the CORS Network and a number of IGS reference stations in the United States and Canada were used to evaluate the performance of OPUS-NET. Blue triangles are CORS stations used as rovers while black triangles are the IGS stations.
2009 EGU General Assembly. 19 – 24th April 2009, Vienna – Poster G1-8798 Neil D. Weston and Jim R. Ray, National Geodetic Survey, NOAA 3. IGS SINEX Stacking Procedure for Coordinate Determination 5. Biases (Accepted – Derived) and Repeatability for 10 of the 94 Randomly Selected Sites 6. Concluding Remarks • New coordinates are derived using the latest IGS and IERS conventions to process RINEX observations • from GPS stations in a global network to obtain new satellite orbits, Earth Orientation Parameters (EOPs) • and global station coordinates. • New coordinates are derived by processing RINEX data for all CORS in the new global framework accessed through the new satellite orbits, EOPs and global station coordinates. • The new coordinates for the 94 CORS stations used as rovers for this experiment were derived resulting in • a fully consistent set of weekly SINEX files for each CORS, which were stacked using the CATREF software • from Institut Géographique National to obtain regularized coordinates and secular velocities. • The CATREF stacking procedure provides detailed weekly CORS + global SINEX files with x, y, z • positions with full variance-covariance information. • The CATREF software was designed to reduce aliasing of Helmert parameters from local and non-linear • motions. • Scatter of daily OPUS-NET results was comparatively low and suggests that the results are very homogeneous. Noisy data from one or a few of the 13 reference stations had minimal impact on the least squares solution. • The results also suggest that the formal sigmas computed by the least squares routines could be a bit too conservative. • There was no significant variation when comparing the NEU scatter between the different duration datasets. • OPUS-NET results agree very well with the IGS SINEX combination (section 5) • but differences depend on whether weights are used or not. • The scatter for ZOLE (4 hr dataset) was larger because day 193 had noisier data in the latter part of the dataset. • The scatter in the results for KOUR could suggest that the tropospheric parameters in OPUS-NET were not optimized for the humid and often rainy environment. One other possibility for larger than normal scatter could be due to poor reference station coverage. 4. Mean Coordinate Sigmas for 97 Reference Stations computed with OPUS-NET 7. References • Weston, N. D. and Ray, J. R. Test of the Use of Regional Networks for OPUS • Processing. Geophysical Research Abstracts. Vol. 12, EGU2010-0, EGU • General Assembly 2010 • Griffiths, J., J. R. Rohde, M. Cline, R. L. Dulaney, S. Hilla, W. G. Kass, J. Ray, • G. Sella, R. Snay and T. Soler. Reanalysis of GPS data for a large and dense • regional network tied to a global frame. IAG Commission 1 Symposium 2010, • Reference Frames for Applications in Geosciences (REFAG2010), • Marne-La-Vallee, France, October 4-8, 2010.


![2011 ITRS Emerging Research Materials [ERM] July 10-13, 2011](https://cdn2.slideserve.com/4220097/2011-itrs-emerging-research-materials-erm-july-10-13-2011-dt.jpg)