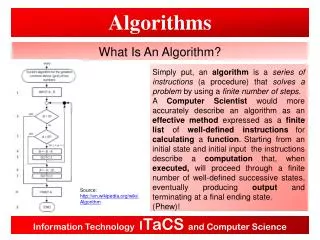
What is Algorithm
An algorithm is a collection of instructions for performing a specific computation or operation. Algorithms originated in mathematics u2013 the word u201calgorithm.u201d It comes from the Arabic writer Muhammad ibn Ms al-Khwrizm.

What is Algorithm
E N D
Presentation Transcript
Definition • An algorithm is a collection of instructions for performing a specific computation or operation. Algorithms originated in mathematics – the word “algorithm.” It comes from the Arabic writer Muhammad ibn Ms al-Khwrizm. An algorithm is a simple, unambiguous definition of what needs to be done. An algorithm generates a specific set of results. It could return the greater of the two numbers, an all-uppercase version of a phrase, or a sorted list of numbers. An algorithm is guaranteed to finish and generate a result after a finite amount of time. If an algorithm could run indefinitely, it would be useless because you would never get a response.
Examples • There are a few algorithms that appear over and over again. We’ll look at three of the most popular in this tutorial: searching, sorting and adding to/removing from a linked list. Understanding these three examples will help us lay a stable basis on which we can confidently tackle potential algorithm problems!
Binary search • Binary search is a simple search algorithm that takes a sorted array as input and returns the index of the value we’re looking for. We accomplish this by taking the following steps:Find the sorted array’s midpoint. • Compare the midpoint to the interest rate. • Perform a binary check on the right half of the array if the midpoint is greater than the value. • Perform a binary check on the left half of the array if the midpoint is less than the value. • Repeat these steps until the midpoint value equals the value of interest or until we know the value isn’t in the array. • The time complexity of the binary search is O(logn). We know this because we only need one more iteration of our algorithm to get to our final answer if we double our input array size. This is why binary search is such an essential computer science algorithm.
Merge Sort • To sort arrays efficiently, merge sort uses a similar “divide and conquer” technique. To see how merge sort is implemented, follow the steps below.Return true if the array has only one element and is already sorted. • Divide the list into halves until it can no longer be divided. • Until we have our original sorted array, combine smaller arrays in sorted order. • Two methods will be specified to implement merge sort. One will deal with breaking up the array, while the other will deal with combining two unsorted arrays into a single sorted array. Recursively, we call the dividing-up method (merge sort) until our array has only one element. After that, we combine them again and return our sorted list. Merge Sort has an O(nlogn) time complexity, which is the highest time complexity possible for a sorting algorithm.
Adding and Removing From a Linked List • The linked list is a basic data structure in computer science that is especially useful for its constant-time insertion and deletion. We can perform certain processes much more quickly with nodes and pointers than we could with an array. A linked list consists of nodes, each containing data and a pointer to the next node. We can remove items from the center of a set with a linked list instead of moving the remainder of the data structure in memory, as we would with an array. We will achieve optimum productivity by selecting the right data structure for our needs!
Use of algorithm • Algorithms have the ability to save lives, make things smoother, and bring order to chaos. However, experts are concerned that they may place too much power in the hands of companies and governments, perpetuating prejudice, creating filter bubbles, limiting options, innovation, and serendipity, and possibly leading to increased unemployment. The overall effect of ubiquitous algorithms is currently incalculable. All of our extended thinking systems (algorithms power the software and communication that allow extended thinking systems) necessitate more thinking, not less, and a broader perspective than we have previously been able to achieve. Expanding data collection and analysis and the application of that data will cure illnesses, alleviate poverty, provide timely solutions to people and places in need, and dispel decades of bias and mistaken assumptions.
Maths behind algorithms • Machine learning algorithms are built so that they learn from their mistakes and enhance their performance as they consume more data. Every algorithm learns and predicts data in its own unique way. The workings of several machine learning algorithms and some of the mathematical equations used in such algorithms aid learning.
Linear Regression • By fitting the best line on the data points, linear regression is used to predict a continuous variable’s outcome. A relationship between the dependent and independent variables is described by the best-fitted line (s). The algorithm seeks out the best-fitting line for predicting the target variable’s value. The best-fit line is found by minimizing the number of squared differences between the data points and the regression line. Equation: Y = c + m₁X₁ + m₂X₂ + ….. +mnXn • Y → Dependent Variable or Target Variable • m → Slope • c → Intercept • X → Independent Variables
Logistic Regression • The classification algorithm logistic regression is used to predict a categorical variable based on the independent variables. It fits the data to a logistic function to estimate the likelihood of an occurrence occurring. Maximizing the probability function optimizes the coefficients of the independent variables in the logistic function. The cost function is minimized by optimizing a decision boundary. Gradient Descent may be used to reduce the cost function. (THE EQUATION COULD NOT BE WRITTEN)
Naive Bayes • The Bayes’ Theorem is the basis for the Naive Bayes classification algorithm. This algorithm assumes that the independent variables have no association. i.e., the existence of one feature in a class does not imply the presence of another feature in that class. We make a frequency table for all predictors against the groups (distinct values of the target variable) and measure their probability. The posterior likelihood for each class is determined using the Naive Bayes equation. The class with the highest probability of all the class probabilities would be the Naive Bayes Classifier’s product. (THE EQUATION COULD NOT BE WRITTEN)
Decision Trees • Decision Trees are typically used to solve classification problems, but they can also solve regression problems. We divide the dataset into two or more homogeneous sets using this algorithm based on the attribute that divides the dataset the most effectively. Calculating Entropy and Information Gain is one approach for selecting the attribute that will break the dataset. The sum of impurity in the variable is captured by entropy. The Information Gain is equal to the parent node’s entropy minus the number of the child nodes’ entropies. For splitting, the attribute with the highest Information Gain is chosen. We may also break the dataset using the Gini Index as an impurity criterion. (THE EQUATION COULD NOT BE WRITTEN)
Random Forests • Random Forests are made up of many Decision Trees that work together to form an ensemble. An Ensemble, rather than a single model, is a set of models used to predict the result. Each decision tree predicts a class outcome in random forests, and the class outcome with the most votes becomes the prediction of random forests. The Decision Trees should be least associated with each other for accurate predictions.
k-NN (k – Nearest Neighbors) • This algorithm is applied to both regression and classification problems. By calculating its distance from all data points, the algorithm finds the k nearest neighbors of data points. Among the k neighbors, the data point is assigned to the class with the most points (voting process). It calculates the mean of the k closest neighbors in the case of Regression.
K-Means • K-Means is an unsupervised learning algorithm used to build data clusters. The clusters should be constructed so that the data points within each cluster are as close as possible while the clusters themselves are as distinct as possible. It chooses K positions at random, each of which serves as the cluster’s centroid. The data points are allocated to the clusters that are closest to them. After the data points have been allocated, each cluster’s centroid is calculated, and the data points are assigned to the closest clusters once more. Furthermore, this method is repeated until all of the data points are in the same cluster, or the cluster centroids do not change between iterations.
Apriori Algorithm • The Apriori Algorithm is a rule-based algorithm that finds the most common item sets in a database. A frequent itemset is one whose support value exceeds a certain threshold (support). • XGBoost • XGBoost is a decision tree-based Gradient Boosting algorithm. It consists of a group of weak learners who work together to make remarkably accurate predictions. Boosting, in other terms, receives the previous model’s errors and attempts to develop the model by learning from them.
Support Vector Machine (SVM) • SVM is a supervised learning algorithm. It solves problems like classification and regression. SVM seeks to find the best hyperplane in N-dimensional space (N refers to the number of features) to distinguish the various groups. Using the Hinge loss function, it finds the ideal hyperplane by maximizing the margin distance between the groups’ observations. The dimension of the hyperplane is N-1 if the number of features is N.
When to choose which algorithm in Machine Learning • The response to which Machine Learning algorithm to use depends on a variety of factors, including the problem statement and the type of output you want, the type and size of the data, the computing time available, the number of features, and the number of observations in the data, to name a few. Here are some important factors to consider when selecting an algorithm.
Size of the training data • To get accurate forecasts, it is better to collect a large amount of data. However, data availability is often a constraint. Choose algorithms with high bias/low variance if the training data is small or the dataset has fewer observations and a higher number of features, such as genetics or textual data. If the training data is large enough and the number of observations is greater than the number of features, low bias/high variance algorithms may be used.
The number of characteristics/features • There may be many features in the dataset, but not all of them are important and meaningful. When dealing with certain types of data, such as genetics or text, the number of features relative to the number of data points can be very high. Some learning algorithms can become clogged by a large number of features, making training time unfeasible. SVM operates best with data that has a wide feature space but few observations. To minimize dimensionality and pick essential features, PCA and feature selection techniques should be used. When choosing an algorithm for a machine learning task, efficiency could be the most obvious metric. However, performance isn’t enough to determine which algorithm is best for the job. Additional parameters, such as memory specifications, training and prediction times, interpretability, and data format, must be met by your model.