Changes in presentations
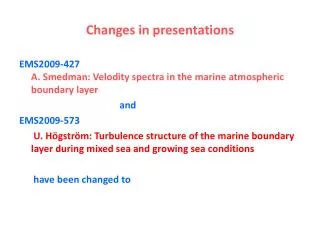
Changes in presentations. EMS2009-427 A. Smedman: Velodity spectra in the marine atmospheric boundary layer and EMS2009-573 U. Högström: Turbulence structure of the marine boundary layer during mixed sea and growing sea conditions have been changed to.

Changes in presentations
E N D
Presentation Transcript
Changes in presentations EMS2009-427A. Smedman: Velodity spectra in the marine atmospheric boundary layer and EMS2009-573 U. Högström: Turbulence structure of the marine boundary layer during mixed sea and growing sea conditions have been changed to
Turbulence structure in the marine atmospheric boundary layer – influences of ocean waves Part I and part II Ann-Sofi Smedman Ulf Högström Uppsala University Uppsala Sweden
We all knowwhy oceans and marine boundarylayers (AMBL) are so important in the climate system? Oceans occupy 70% of the Earth surface Oceans have a large heat capacity Oceans are a large sink of CO2 Ocean waves influence the turbulent transport in AMBL and thus the air-sea exchange
In models the air-sea exchangeis described through Monin-Obukhov similarity theorya theory which is well tested over landbutis it valid over the ocean?
Analysis of data from BASE (BAlticSea Swell Experiment) • Measurements • Tower: turbulence and profiles • ASIS bouy: turbulence and profiles, wave parameters • Wave Rider Bouys: wave parameters • R/V Aranda: turbulence and wave parameters • Collaboration between • MIUU Uppsala, Swden • RSMAS, Miami, USA • FMRI, Helsinki, finland
Long term measurements in the Baltic Sea 2 buoys (temp, wave height , dir. and CO2 Footprint area 1000 2200 Tower 30 m Temp and wind profiles 5 levels Turbulence 3 levels Humidity and CO2 at 2 levels
Short term experiments with RV Aranda and ASIS buoy Turbulence, wind speed, temperature and wave parameters In the mean, excellent agreement between tower and ASIS
Characterizing the sea stateDefinition of wave age: cp/U10 or cp/U10cos?cp=phase speed, U =wind speed
ua uα cp cp There is a small phase shift between p and w and depending on the sign the energy transport is upwards or downwards
The data • One case with growing sea defined as cp/U8 <0.7 • One case (F1) has cp/U8 about 5 and is considered as pure swell, one case ( F2) has cp/U82 (weak swell) • One case has cp/U80.9 and is defined as mixed sea All cases consist of about 10 hours of data
The turbulence kinetic energy budget Note that the terms on the right hand side are found to be close to zero so the pressure transport term can be obtained as a residual of the remaining four terms, which can all be obtained from the measurements
Results of the TKE-analysis • The pure swell cases : • Mechanical production, P = 0; • Pressure transport, Tp positive ,i.e. a gain of TKE • Tp thus tends to accelerate the flow but it is balanced by molecular friction at the surface (low level wind maximum).
Turbulence spectra of the u and w components during strong swell
Strong resemblence with free convection spectra • but • The main source of turbulence is not heat flux. • Energy is taken from the waves and transported upwards through the pressure transport term
Pressure transport acts directly vertically and effects the whole boundary layer • Creating large eddies (boundary layer scale)
From the turbulence energy eq the 3:e component reads, Both bouancy and pressure transport are input to the w- component
Similarity between swell and free convection:u* 0 and eddies scale with boundary layer height Convective scaling where
Convective boundary layer over land • 0.5-0.7 (Kaimal et al. 1976) but • In the marine boundary layer dyring swell • 2 (BASE and Utlängan) • Heat flux is not the source of turbulence
Conclusions • Monin-Obukhov similarity teory is only valid for growing sea cp/U<0.7 • When swell dominates (cp/U8 large), an exponentially decreasing function for Tp fits the data well. • Swell thus tends to accelerate the flow but is balanced by molecular friction at the surface (low level wind maximum).
Velocity spectra • ’Convective scaling’ can be applied for strong swell conditions and large eddies tend to move towards isotropy