Download
1 / 90
1.16k likes | 2.24k Vues
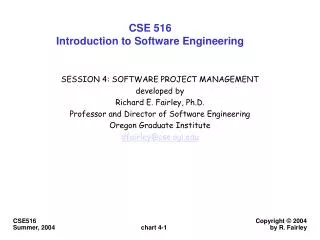
CSE 516 Introduction to Software Engineering. SESSION 4: SOFTWARE PROJECT MANAGEMENT developed by Richard E. Fairley, Ph.D. Professor and Director of Software Engineering Oregon Graduate Institute dfairley@cse.ogi.edu. SESSION TOPICS. Planning and Estimating Measuring and Controlling

E N D
CSE 516Introduction to Software Engineering SESSION 4: SOFTWARE PROJECT MANAGEMENT developed by Richard E. Fairley, Ph.D. Professor and Director of Software Engineering Oregon Graduate Institute dfairley@cse.ogi.edu
SESSION TOPICS • Planning and Estimating • Measuring and Controlling • Leading and Directing • Communicating and Coordinating • Managing Risk Factors
What Is A Project? • A project is a coordinated set of work activities that: • has a starting date and an ending date • has well-defined objectives • has allocated schedule and resources • has a qualified project team • has assigned roles and responsibilities • produces one or more tangible work products
What Is Management? • Management is concerned with identifying, planning, coordinating, and leading the work activities of groups of people • so that they can accomplish more than the groups could accomplish if each person acted on their own without coordination of their work activities
WHAT IS PROJECT MANAGEMENT? Managing a software project involves several types of work activities: • Planning and Estimating • schedule, resources, processes, technology • Measuring and Controlling • quality, productivity, progress • Leading and Directing • the project team members • Communicating and Coordinating • with managers, other departments, other projects, other companies, customers, users, acquirers, . . . . • Managing Risk • identifying, prioritizing, and handling potential problems and real problems
Project Management Roles • A software project requires two types of management roles: • the project manager (the producer role) • the project manager is responsible for delivering a satisfactory product on schedule and within budget • the software architect (the director role) • the software architect is responsible for the technical content of the product
Manager and Architect Roles • The project manager, working with the customer, higher level management, and the software architect is responsible for a successful outcome • and (we hope) has the authority to make the necessary decisions • The software architect is responsible for developing technical options, presents them to the decision makers (project manager, customer, and higher level management) • and (we hope) has the authority to successfully implement the chosen alternatives
What Is Project Management? • Project management is concerned with identifying, planning, coordinating, and controlling the work activities of a software project to deliver, on time and within budget, a product that satisfies user needs and customer expectations • The major activities of project management are: • planning and estimating • measuring and controlling • leading and directing • communicating and coordinating • managing risk
A Workflow Model for Managing Software Projects Change Requests and Problem Reports Requirements and Constraints Product Development customer Planning and Replanning Work Assign- ments Independent Validation Activity Definition management product Quality Assurance Directives and Constraints Estimating Controlling Configuration Management Data Retention . . . . . . . . . . . . .. . . . Project Reports Status Reports Reporting Measuring
Project Foundations • A software project should have the following foundations: • Product foundations include: • the system requirements* • the system design constraints • the software requirements* • Process foundations: • an engineering process model** • a workflow model • a contractual agreement • a project plan * see Session 3 **see Session 2
The Contractual Agreement A contractual agreement should contain: • scope of work • deliverable work products • delivery date(s) • customer & user review schedule • change request procedures • development constraints • product acceptance criteria • delivery, installation, and training schedule (if appropriate) • price and payment schedule (if appropriate) the contractual agreement is sometimes called a Statement of Work (SOW) or a Memo of Understanding (MOU)
Contents of A Project Plan- IEEE Standard 1058 - A project plan should contain: • A list of work products to be developed • References to other foundation documents • Organizational roles and responsibilities • Development methods and tools • Mechanisms of measurement and control • Necessary resources with need dates and costs • Work activities with detailed schedules and budgets • Risk factors and contingency plans • On-going risk management procedures • Plans for updating the plan
Plans versus Requirements • The requirements describe what product(s) to make • The project plan is the roadmap for making the product(s) • a map helps us to determine the best route to follow • a map helps us to communicate our planned route • a map allows us to measure progress • a map can be used to determine alternate routes • a map can help us find the way back if we get lost Q: which comes first, the requirements or the project plan??
Planning Tools • Some tools for planning a software project: • the work breakdown structure (WBS) • work packages • the schedule network • the Gantt chart • resource profiles
The Work Breakdown Structure • A work breakdown structure is a hierarchical tree structure used to: • specify work activities • depict the “is part of” relationships among work activities • decompose work activities into tasks* for small teams and individual workers * a task is the smallest unit of work for management accountability activities are composed of tasks
A WBS Example: ATMSoftware Project Software Dvmt. Quality Assur. Config. Mgmt. System Interfs. Integr. & Test User Docs. Project Mgmt. Build ATMHD Build FINAT Build MAINT Integrate & Test ATMHD, FINAT, MAINT Build Validator Build Processor Build Recorder Build Terminator Integrate Validator, Processor, Recorder, Terminator – – – – DES DES DES DES – – – tasks – CUT CUT CUT CUT – – – – CIT CIT CIT CIT ATMHD: ATM Hardware Drivers DES: Detailed Design FINAT: Financial Transactions CUT: Code & Unit Test MAINT: Maintenance Diagnostics CIT: Component Integration & Test
WBS Numbering ATMSoftware Project 4 1 2 3 5 6 7 3.1 3.2 3.3 3.4 3.2.1 3.2.2 3.2.3 3.2.4 3.2.5 – – – 3.2.1.1 3.2.2.1 3.2.3.1 3.2.4.1 – – – – – 3.2.1.2 3.2.2.2 3.2.3.2 3.2.4.2 – – – 3.2.1.3 – 3.2.2.3 3.2.3.3 3.2.4.3
Partial WBS for anATM Project ATMProject 1. 5. 6. 2. 3. 4. 7. Config. Mgmt. Tech. Pubs. System Test Project Mgmt. System Analysis Quality Assur. Software Dvmt. 1.1. 1.2. 3.3. Build MAINT 3.1. Build ATMHD 3.5. Integrate ATMHD, FINAT, MAINT & COMM 3.4. Build COMM 3.2. Build FINAT 3.2.2. 3.2.1. 3.2.4. 32.3. 3.2.5. Integrate FINAT Build Terminator Build Validator Build Processor Build Recorder 3.2.4.1DEST (Design Terminator) 3.2.1.1 DESV 3.2.2.1 DESP 3.2.3.1 DESR – – – – – – 3.2.2.2 CUTP – – 3.2.4.2CUTT (Code & Unit Test Terminator) 3.2.3.2 CUTR 3.2.1.2 CUTV – – – – 3.2.2.3 ITPC 3.2.3.3 ITRC 3.2.1.3 ITVC 3.2.4.3 ITTC (Integrate & Test Term. Components)
Outline Form of the WBS 1. Project Management 2. System Analysis 3. Software Engineering 3.1. Build ATM Hardware Drivers 3.2. Build Financial Transaction Handler 3.2.1. Build Validator 3.2.2. Build Transaction Processor 3.2.2.1. Design Transaction Processor 3.2.2.2. Code & Unit Test Transaction Processor 3.2.2.3. Integrate & Test Processor Components 3.2.3. Build Recorder 3.2.4. Build Terminator 3.3. Build Maintenance & Diagnostic Subsystem 3.4. Build the Communications Package 3.5. Integrate ATMHD, FINAT, MAINT, and COMM 4. System Test 5. Quality Assurance 6. Configuration Management 7. Technical Publications
WBS Notes • The product structure is embedded in the work breakdown structure • The Decimal numbering system is used to identify the elements in the WBS • the number indicates the position of the element in the WBS • the number of digits in the WBS number indicates the depth of the element • The example WBS is 4 levels deep • Depending on the size and complexity of the product being developed, the WBS for most projects will be decomposed in a range of 4 to 6 levels
WBS Work Packages • Each work element in a WBS is documented in a work package • A work package specifies: • the activity identifier (number, name and description) • types and numbers of resources required • planned duration • required predecessor work activities • successor work activities • work products to be produced • acceptance criteria for the work products • risk factors for the work package
A Work Package Example Activity : 3.2.2.1 DESIGN_TRANSACTION_PROCESSOR Activity description: Specify internal structure of the Transaction Processor (TP) Estimated duration: 2 weeks Resources needed: Personnel: 2 senior designers Skills: Designer must know the TP domain and Statemate Tools: One Sun workstation running Statemate Travel: 3 day Design Review in San Diego for 2 people Predecessor tasks: 2.3.1 - Develop TP requirements Successor tasks: 3.2.2.2 - Implement Transaction Processor Work Products: Architectural specification for TP Test plan for TP Baselines Created: Architectural specification for TP Test plan for TP Completion criteria: design and test plan inspections by peers and sign-off of TP design by the Software Architect Risks: senior designers not identified
An Activity List for a Software Project Activity #DescriptionPred.Duration #Staff 3.1 Analyze requirements - 1 2 3.2 Redesign existing components 3.1 6 4 3.3 Design new components 3.1 3 1 3.4 Design interfaces 3.3 1 2 3.5 Implement new code 3.3 6 2 3.6 Develop integration plan 3.3 2 2 3.7 Modify existing code 3.2, 3.4 5 1 3.8 Finish unit testing 3.5, 3.7 1 2 3.9 Update documentation 3.5, 3.7 2 3 3.10 Develop integration tests 3.6 1 3 3.11 Perform integration tests 3.8, 9, 10 1 2 3.12 Perform acceptance tests 3.11 1 1
The Activity Network - Critical Path Method (CPM) 5 3.6 (2) (1) 3.10 3 3.3 (3) (6) 3.5 3.11 3.1 3.12 2 8 9 10 1 (1) (1) (1) (1) 3.8 (2) 3.4 (0) 3.9 3.2 3.7 6 4 7 (6) (5) (1) x.y = Activity; x = Milestone; (x) = Activity duration
Activity Gantt Chart with Slack Times 3.1 3.2 3.3 3.4 3.5 3.6 3.7 3.8 3.9 3.10 3.11 3.12 1 3 11 13 15 5 7 9 WEEK
Earliest Start-Time Staffing Profile EARLY START PROFILE
Latest Start-Time Staffing Histogram LATEST-START PROFILE
A RESOURCE–LEVELLEDSTAFFING PROFILE 10 # STAFF 8 6 4 2 1 2 3 4 6 7 8 16 5 9 10 11 12 13 14 15 WEEK
A Constrained Staffing Profile 10 # of People 8 6 4 2 1 2 3 4 6 7 8 16 5 9 10 11 12 13 14 15 Week
WHAT TO DO? • Add more people? • Take more time? • Descope the requirements? • Use more efficient (and effective) resources? • Play “chicken?” • Plan for overtime? • Sacrifice quality? • reduce testing • reduce documentation • eliminate on-line help messages
Project Estimation • The following project factors must be estimated: • effort and other resources (= cost) • schedule with milestones • product size and complexity • product quality (defects, safety, security, ...) • risk factors
Project Estimation - II • An estimate is a projection from past to future, suitably adjusted to account for differences between past and future • past: history of past projects • future: requirements for the product • adjustment factors: to account for difference between past and future
Elements of Estimation Historical Data Future-Product Attributes Estimate Adjustment Factors Estimation Procedure Assumptions and Constraints* * Assumption: something taken to be true Constraint: an imposed must-be or must-do
Some Adjustment Factors* for Software Projects • ‘goodness’ of the requirements • Size of data and code • Complexity of data and code • Required reliability • Time and memory constraints • Quality of the development tools • Familiarity of the development tools • Engineering processes used • Engineering methods used • Experience in the application domain • Skills and motivation of the people • Schedule pressure *factors that make seemingly similar projects differ in effort, schedule, quality, . . .
Estimation Techniques • Estimation techniques include: • Analogy • Rule of Thumb • Expert Judgment • Designing to Cost and Schedule • WBS/activity network/resource loading • Algorithmic Models • theory-based models (e.g., SLIM) => regression-based models (e.g., COCOMO)
Regression-Based Estimation Models • Analysis of past projects might show a “best-fit” relationship between project size and work effort of the form: Effort = A * (Size) ^ B; • for example: Effort = 2.5 * (Size) ^ 1.25 where Effort is in Person-Weeks and Size is in Thousands of Delivered Lines of Code • Adjustment factors (AFs) are then applied to the Effort estimate to adjust it up or down Effort = A * (Size) ^ B * Õ AFs Q: why is the Effort-Size relation non-linear?
Deriving A Regression Model log SM = log a + b * log LOC SM = a * (LOC)^b e.g. SM = 2.8 * LOC ^ 1.25 log Staff-Months * 4 (10000) Project Histories: * * * * b * * * * * 3 (1000) * * • * * * * * * * * * * * * why do projects of the same size require different amounts of work? 2 (100) * * * * * * * • * * * * 1 (10) * * * log a log LOC 3 (1k) 4 (10k) 6 (1000k) 5 (100k)
An Example • Suppose we estimate the product size to be 50,000 lines of code • Then the unadjusted effort estimate is: • Effort = 2.5 * (50) ^ 1.25 • Effort = 2.5 * 133 = 332 person-weeks • Suppose we assume skilled people and a familiar job; we will reduce the estimate by 20% • Adjusted Effort = 0.8 x 332 = 266 staff-weeks • Effort can then be broken down into combinations of people and time; for example: • 10 people for 26 weeks • but probably not 26 people for 10 weeks • and not 266 people for one week
Regression-Based Estimation log Effort, E (Staff-Months) * 4 (10000) E = 2.5 * (S) ^ 1.25 * Project Histories: * * * * * * * * 3 (1000) * * * * * * * X * * • * * * * * * 266 staff-weeks 2 (100) * * * * * * * * * * 1 (10) * log Size, S (LOC) 3 (1k) 4 (10k) 6 (1000k) 5 (100k)
Effort, Schedule, and Cost • Effort is the amount of work required to accomplish a work activity • for example, 266 person-weeks (PWs) • Schedule is the amount of time required to accomplish a set of work activities • for example, 26 weeks • To accomplish a 266 person-week project in 26 weeks, we need 266 / 26 = 10 people • Labor cost is determined by loaded salaries • for example, if loaded salaries are $10,000 per person-month, a 266 person-week (66 person-month project will cost $660,000 for salaries (or 660/50 = $13 per LOC)
Productivity and Unit Cost • Productivity is the ratio of product produced to effort consumed • Average productivity for the project is: • 50,000 LOC / 660 PW = 75 LOC/PW • Unit cost is: • $660,000 / 50,000 LOC = $13 per LOC • for salaries for design, coding, and testing • note: a typical cost for developing applications programs such as spreadsheets and word processors is $35 to $50 per LOC
Productivity and Production Rate • Productivity is: Output_Produced / Resources_Used for example: if we design, write, and test 3000 lines of code using 6 person-weeks of effort, our productivity is 3000 / 6 = 500 LOC / PW (500 Lines-Of-Code per Person-Week) • Production rate is the amount of output produced by everyone working at an activity if 3 people each produce 500 LOC/PW the production rate for each week is 1500 LOC • Productivity and production involve both quantity of output and quality of output produced
A Question Who is more productive? The person who writes 500 lines of poor quality code in 5 days (100 LOC/PD) or the person who thinks about it, reads some books, and talks to people for 4 days then writes 50 lines of high quality code on the 5th day (10 LOC/PD) to do the same thing? LOC/PD: lines-of-code per programmer-day
Rework and Productivity • There are two types of rework: • evolutionary rework • avoidable rework • Evolutionary rework occurs when we add enhancements to increase the value of the product for the users • evolutionary rework must add value, otherwise it is avoidable rework • Avoidable rework occurs: • when we correct mistakes that we could have avoided • when we have to redo a poorly done job • Avoidable rework reduces our net productivity and our net production rate
Productivity - II • We must distinguish net productivity from gross productivity: Net = Gross - Avoidable Rework* In many organizations, avoidable rework amounts to 30% to 50% of all work activities in software development and modification • Net productivity varies widely among individuals and organizations • factors of 10 or 20 are not uncommon • largely caused by variations in avoidable rework
Avoidable Rework • Avoidable rework is caused by • lack of skill, training, or tools • lack of cost-effective work processes • inadequate communication • excessive schedule pressure • poor motivation, morale, or leadership • human fallibility • other reasons?
Estimation Techniques • Estimation techniques include: • Analogy • Rule of Thumb • Expert Judgment => Designing to Cost and Schedule • WBS/activity network/resource loading • Algorithmic Models • theory-based models (e.g., SLIM) • regression-based models (e.g., COCOMO)
Designing to Cost and Schedule • How to estimate a schedule-constrained project? • What to do if we don’t have enough historical data to build a regression model? Design to cost and schedule: • Suppose we have 5 people to do a project in 6 months (5x6=30 staff-months of effort) • Also suppose we know our past productivity on a similar project was 500 LOC/SM • Then we can build a product of 15,000 LOC • (30x500 = 15,000)
Designing to Cost and Schedule - II • Q: What to do if we have no historical data and no productivity numbers? • A: Prioritize the requirements and pursue an iterative approach until the scheduled delivery date arrives • use a prioritized, spiral approach so that the most important parts are completed first
Measuring Software Size by Lines of Code • Lines of code may not be a good size measure: • measuring productivity by LOC may encourage developers to write lots of lines of bad code • use of modern methods and tools makes it difficult (or irrelevant) to measure lines of code