
Uploaded by
dixon
0 SLIDES
693 VUES
120LIKES
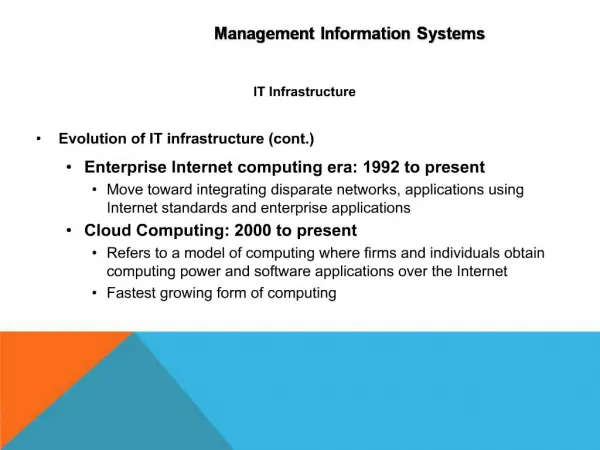
IT Infrastructure
DESCRIPTION
IT Infrastructure. Chapter 2: Non functional Attributes. It infrastructure provides services to applications Many of these services can be defined as functions such as disk space, processing, connectivity However most of these services are non functional in nature
Download

1 / 0
Télécharger la présentation 
IT Infrastructure
An Image/Link below is provided (as is) to download presentation
Download Policy: Content on the Website is provided to you AS IS for your information and personal use and may not be sold / licensed / shared on other websites without getting consent from its author.
Content is provided to you AS IS for your information and personal use only.
Download presentation by click this link.
While downloading, if for some reason you are not able to download a presentation, the publisher may have deleted the file from their server.
During download, if you can't get a presentation, the file might be deleted by the publisher.
E N D
Presentation Transcript
-
IT Infrastructure
Chapter 2: Non functional Attributes - It infrastructure provides services to applications Many of these services can be defined as functions such as disk space, processing, connectivity However most of these services are non functional in nature Non functional attributes describe the qualitative behavior of the system rather than its specific functionality and these include Availability Security Performance Recoverability Testability Scalability
- The ISO 9162 Standard This describes the major groups of non functional attributes
- Based on these groups ISO 9126 defines 27 non functional attributes each with their own scope. In the following table they are defined and mapped to the three major non functional attributes and on issues that are more relevant for the system management realm
- Handling Conflicting NFRs It is not unusual to encounter conflicting NFRs for instance users may want a system that is secure but not want to be bothered by passwords It is the task of the infrastructure architect to balance these NFRs, in some cases some NFRs may take priority over others and the architect must involve the relevant stakeholders
- Availability Concepts Everyone expects their infrastructure to be always on all the time but regardless the amount of time invested there is always a chance of downtime and 100% uptime is impossible Calculating Availability Availability cannot be calculated nor guaranteed upfront but rather is reported after the system has run for sometime probably years Fortunately over the years a lot of information has accumulated on the subject and certain design patterns have emerged such as redundancy, failover, structured programming, avoiding Single Points of Failures and implementing proper systems management
- Availability percentage Availability is always given as a percentage uptime given a time period which is usually one year, the following table shows the permitted downtime given a certain availability over one year
- Typical availability perecentages Most requirements used today are 99.9% (three nines) or 99.95% for a full IT system 99.999% is also known as carrier grade, this availability originates from the telecommunications components that need a very high availability Although 99.9% availability means 525 minutes of downtime a year, this downtime must not occur in a single event and there should also not be 525 one minute downtime events in a year , in other words unavailability intervals must be defined
- Sample unavailability intervals
- MTBF and MTTR Unavailability intervals are the product of MTBF (Mean Time Between Failure) which is the average time between successive downtime events and MTTR (Mean Time To Repair) which is the average duration of a downtime event
- Sample MTBF calculation Usually manufactures run tests on large batches of devices for instance they could test 1000 hard disks for 3 months (1/4 a year) If 5 hard disks fail then over a year the extrapolated figure is 4 x 5 which is 20 hard disks The total uptime for 1000 disks is 1000 x 365 x 24 which is 8, 760, 000 hours So MTBF is total uptime 8,760,000/20 failed drives (each failed drive is a single failure event) which gives 438,000 hours per drive
- MTTR (Mean Time To Repair) Usually the MTTR for components is kept low by having a service contract with the suppliers of the component Sometimes spares are kept onsite MTTR contains the following components Notification of the fault (time before seeing an alarm message) Process the alarm Diagnose the problem Look up repair information Get spare components Retrieve the components Repair the fault
- Additional Calculations Availability = 100% x MTBF / (MTBF + MTTR) As a system becomes more complex availability normally reduces If the failure of any system component leads to failure of the system as a whole then it is said to have serial availability To calculate the availability of such a system you multiply the availability of all its components
- Serial Availability
- Parallel Availability As can be seen from the illustration the availability of the full server is less than that of any individual component, to increase availability the components can be arranged in parallel
- Overall availability of parallel systems with 99% availability
- Sources of unavailability Human Error Software Bugs Planned Maintenance Physical defects Environmental issues System complexity: Generally it is much more difficult to maintain availability of large, complex systems with several components
- More on physical defects The likelihood of failure of a component is highest at the beginning of its life cycle Sometimes a component does not work at all after it is unpacked, the so called DOA or Dead on Arrival If a component works without failure for the first month it becomes increasingly more likely that it will work uniterrupted till the end of its lifecycle which is the other end of the bathtub where the likelihood of failure increases exponentially
- Availability Patterns Single Points of Failures (SPOFs): Are infrastructure components whose failure implies system downtime. They are not desirable but in practice may be difficult to eliminate Redundancy: Is the duplication of infrastructure components to eliminate a SPOF Failover: The semi automatic changeover from a failed component to a standby component in the same location e.g. Oracle Real Application Clusters (RAC) and VMWare’s high availability technology Fallback: The changeover from a failed computer to another with an identical configuration in a different location
- Fallback Hot site Is a fully configured fallback computer facility with cooling and redundant power, applications that permits rapid restoration of services in the event that the primary system fails. As is apparent it is expensive to maintain Warm site Is a mix between a warm site and a cold site. Like a hot site it has power, cooling and computers but applications may not be installed or configured Cold Site A cold site differs from the other two in that there are no computers onsite, it is a room with power and cooling facilities and in order for it to be brought online computers must be brought in rapidly
- Business Continuity Management ad Disaster recover Planning Although measures can be taken to provide high availability there are always situations that can not be completely safeguarded against like natural disasters and in such cases you have to think of Business Continuity Management(BCM) and Disaster Recovery Planning (DRP). BCM is concerned with the business issues including IT whereas DRP is about the IT
- Business Continuity Planning Is about identifying the threats an organization faces and creating appropriate contingencies. BCM is about ensuring a business continues operating in times of disaster and includes managing business processes, availability of people and work places in disaster situations. It includes disaster recovery, business recovery, crisis management, incident management, emergency management, product recall and contingency planning BCM has two objectives namely RTO (Recovery Time Objective) and Recovery Point Objective (RPO) RTO defines the time and service level within which an organization must be restored after a disaster so as to avoid the unacceptable consequences of non operation RPO describes the acceptable amount of data loss an organization is willing to accept. Defined in time it is the point to which data must be restored considering some acceptable data loss during a disaster DRP is the IT component of BCM


More Related