Effective Data Presentation Strategies: Boosting Performance and Understanding Trends
200 likes | 216 Vues
Presenting data as a bunch of numbers can be difficult to interpret, even if you have multiple PhDs. Visual presentations make it easier to see patterns, trends, and the significance of different data segments. This chapter explores various methods such as histograms, bar charts, stem-and-leaf displays, and pictograms to present and organize data effectively. Learn how to represent data in a way that is representative, useful for forecasting, and enhances understanding. Enhance your performance by mastering the art of data visualization and exploration.

Effective Data Presentation Strategies: Boosting Performance and Understanding Trends
E N D
Presentation Transcript
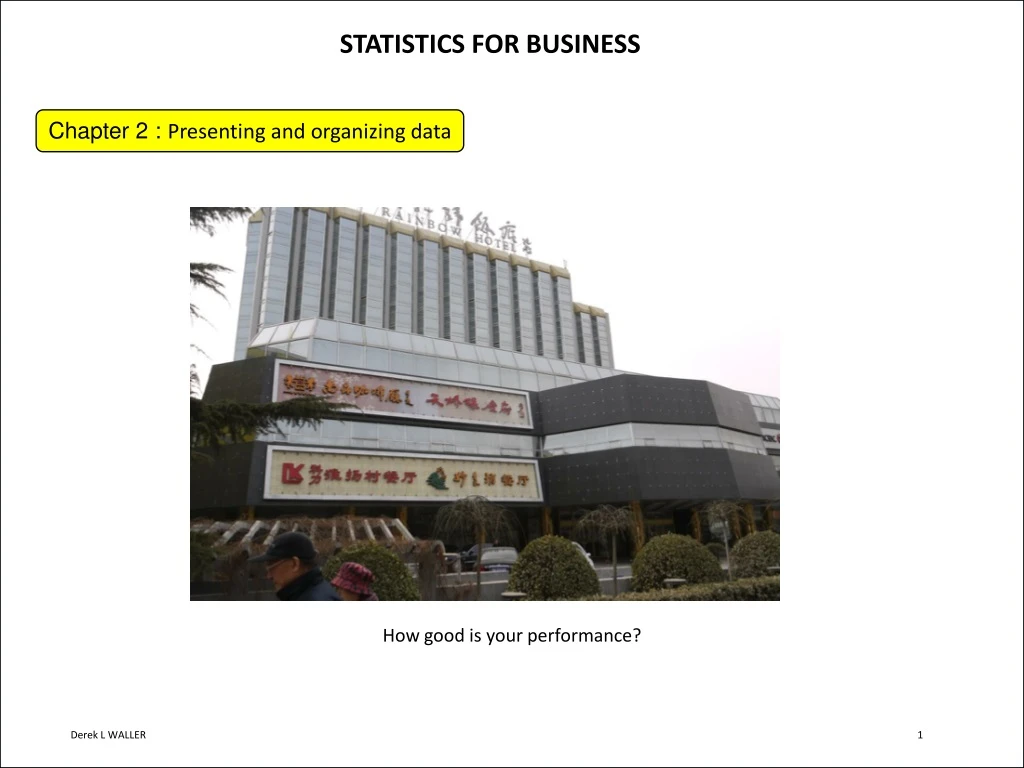
STATISTICS FOR BUSINESS Chapter 2 : Presenting and organizing data How good is your performance?
STATISTICS FOR BUSINESS (Presenting and organizing data) Weekly hotel operating costs Presenting data as a bunch of numbers is difficult to interpret - even if you have 3 PhD’s How good is your performance? You should be shot if you present data in this manner! How good is your performance? Making visual presentations it is easier to see patterns, trends, and importance of segments of the information
STATISTICS FOR BUSINESS (Presenting and organizing data) How good is your performance?
STATISTICS FOR BUSINESS (Presenting and organizing data) If representative useful for forecasting and probability How good is your performance?
STATISTICS FOR BUSINESS (Presenting and organizing data) How good is your performance?
STATISTICS FOR BUSINESS (Presenting and organizing data) How good is your performance?
STATISTICS FOR BUSINESS (Presenting and organizing data) How good is your performance?
STATISTICS FOR BUSINESS (Presenting and organizing data) Gives proportions above and below certain levels How good is your performance? Median
STATISTICS FOR BUSINESS (Presenting and organizing data) Stem and lead display of hotel weekly costs How good is your performance? Shows amount of data in certain segments
STATISTICS FOR BUSINESS (Presenting and organizing data) How good is your performance? Shows uniformity of data
STATISTICS FOR BUSINESS (Presenting and organizing data) How good is your performance?
STATISTICS FOR BUSINESS (Presenting and organizing data) Illustrates trends How good is your performance?
STATISTICS FOR BUSINESS (Presenting and organizing data) Illustrates trends – be careful of scale How good is your performance?
STATISTICS FOR BUSINESS (Presenting and organizing data) How good is your performance? Gives proportion of the “whole”
STATISTICS FOR BUSINESS (Presenting and organizing data) Histogram: Compares successive periods How good is your performance?
STATISTICS FOR BUSINESS (Presenting and organizing data) How good is your performance? Bar chart: Compares successive periods
STATISTICS FOR BUSINESS (Presenting and organizing data) How good is your performance?
STATISTICS FOR BUSINESS (Presenting and organizing data) How good is your performance?
STATISTICS FOR BUSINESS (Presenting and organizing data) How good is your performance? A powerful auditing tool
STATISTICS FOR BUSINESS (Presenting and organizing data) How good is your performance? Pictograms illustrating inflation Not useful analytically to present data But the media uses it to alarm readers The value of money tomorrow The value of money today