Download
1 / 44
440 likes | 459 Vues
Explore government payment scenarios and policy analysis for agricultural safety nets. Presented at Texas Cattle Feeders, highlighting program comparisons.

E N D
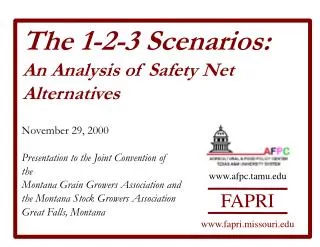
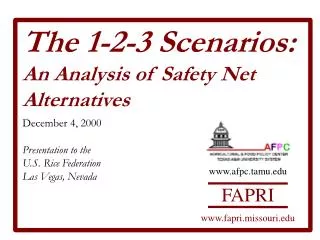
www.afpc.tamu.edu FAPRI www.fapri.missouri.edu The 1-2-3 Scenarios An Analysis of Safety Net Alternatives and The Flex-fallow Program The 1-2-3 was Prepared at the Request of Rep. Charles Stenholm The Flex-fallow was Prepared at the Request of Senators Harkin, Daschle, and Johnson January 16, 2001 Presentation to the Texas Cattle Feeders Amarillo, TX
Direct Government Payments FAPRI 25 23.3 20.6 20 16.7 14.5 15 13.4 12.4 Billion Dollars 12.2 11.8 9.5 10 5 0 1979 1983 1987 1991 1995 1999 Direct Payments 1986-2000 Average = $12.0 Billion Standard Deviation = $4.8 Billion
FAPRI Direct Government Payments
FAPRI • Analysis, prepared at the request of Rep. Charles Stenholm, is compared to the FAPRI January, 2000 baseline. • The baseline assumes provisions of the FAIR Act with 2002 levels extended for the life of the baseline. • We need to remember a few things about the baseline because it does have a bearing on the outcome of the scenarios. First, a word about the baseline...
FAPRI • In general, baseline crop prices are weak in the near term before showing recovery in later years. • For soybeans and cotton, loan rates continue to play a large role through 2005. US Crop Prices
FAPRI • For the scenarios, all baseline policies remain in place, i.e. AMTA payments remain. • In addition, assume authority exists for additional spending above baseline levels for the 2001-05 crops. • Average $1 Billion/Crop Year ($5 Billion Total) • Average $2 Billion/Crop Year ($10 Billion Total) • Average $3 Billion/Crop Year ($15 Billion Total) Scenario Assumptions
FAPRI • Spend the additional money in three ways • Modified Supplemental Income Payments (MSIP) - Payments based on 1995-99 reference period. • Higher Marketing Loan Rates (LR) - Increase all loan rates by the same percentage in order to achieve the additional spending. • Market Loss Assistance (MLA) Payments - Distributed in the same fashion as the previous MLA payments. Some money included for oilseeds. • Precise levels for loan rates and SIP triggers set so as to spend on average the same amount as the increase in MLA payments. More Assumptions
FAPRI • Relative to the FAPRI baseline, MSIP will play a larger role in the early years as the value per acre falls well below the 1995-99 average. • Over time, stronger prices and increasing yields reduce the gap between the value and the reference period. Modified SIP for Corn: Where the Baseline Is Important
FAPRI • Corn -- $306.73 • Cotton -- $402.14 • Rice -- $516.11 • Soybeans -- $232.36 • Wheat -- $135.38 MSIP Trigger Levels
FAPRI • In the FAPRI baseline, loan rates are held fixed through the 2001 crop and then allowed to adjust to minimum levels based on the formulas. • Rice loan rate remains at $6.50 in the baseline. • The scenarios maintain this convention with loan rates for all crops increased by the same percentage above baseline levels. Loan Rate Formulas for Corn: Where the Baseline Is Important
FAPRI • Market Loss Assistance payments are allocated based on percentages from the previous assistance packages. • Feed grains receive 50% of the money under these rules. • Rice receives 8% of the money. Market Loss Assistance
FAPRI Policies Analyzed in this Study • 3 ways to spend an additional money above baseline spending over the 2001-05 crops. Avg Annual Additional Spending $1 Billion $2 Billion $3 Billion MSIP (Trigger %) 89.80% 93.86% 96.75% LR Increase Above Base 3.50% 6.67% 9.60% MLA Payments $1 bil/crop yr $2 bil/crop yr $3 bil/crop yr
FAPRI Multiple Draws Must Be Done, Example for Corn Yields • Looking at one possible path doesn't provide enough information. • Program must be evaluated over a number of runs. We have done 500 simulations. • Graph shows 10 of the 500 corn yield paths used in this analysis. • Remember - all other shocks are being introduced at the same time. U.S. Corn Yield
FAPRI • The results of the 500 draws will give variability around production, consumption and prices. • We can develop probabilities ranges or the likelihood that price will be in a certain range. Generating Results, Developing Probability Ranges
FAPRI • Of the 3 optionsCotton receives the most under SIP Rice payments are highest under MLACorn receives largest payment under MLASoybeans receive the most under LRWheat payments are highest under MLA Rankings the same under alternative spending levels. Change in Per-Acre Returns, $2 Billion Scenario
FAPRI Distribution of Gov't Outlays, $2 Billion Scenario • Average spending levels are similar under all 3 programs ($12.6 Bil) • With fixed payments, there is a higher minimum under MLA. • In all cases, much more upside spending potential than downside. Average
FAPRI Distribution of Cotton Returns, $2 Billion Scenario • Average returns under LR2 and MLA2 are $165/ac. Average under MSIP2 is $169. • Note the different shape relative to corn returns • Skewed in the opposite direction. Distribution of Cotton Per-Acre Net returns, 2004 $2 Billion Scenario Averages Average Frequency 25 50 75 100 125 150 175 200 225 250 275 Net Returns (Dollars per Acre) MSIP2 LR2 MLA2 165 165 169
FAPRI Distribution of Corn Returns, $2 Billion Scenario • Returns average $155 under MSIP2 and MLA2. Average is $151 under LR2. • SIP reduces more of the downside risk in returns. Distribution of Corn Per-Acre Net Returns, 2002 $2 Billion Scenario Averages Frequency 75 100 125 150 175 200 225 250 275 300 Net Returns (Dollars per Acre) LR2 MSIP2 MLA2 151 155 155
FAPRI MSIP2 MLA2 Distribution of Soybean Returns, $2 Billion Scenario • Returns average $132 under MSIP2 and $135 under LR2. Average is $128 under MLA2. • SIP reduces more of the downside risk in returns. Distribution of Soybean Per-Acre Net returns, 2002 $2 Billion Scenario Averages Frequency 75 100 125 150 175 200 Dollars per Acre LR2 128 132 135
FAPRI MSIP2 LR2 Distribution of Wheat Returns, $2 Billion Scenario • Returns average $72 under MSIP2 and $67 under LR2. Average is $73 under MLA2. • SIP reduces more of the downside risk in returns. Distribution of Wheat Per-Acre Net returns, 2002 $2 Billion Scenario Averages Frequency 25 50 75 100 125 Dollars per Acre MLA2 67 72 73
FAPRI • PROS • Based on high income period of time • Most downside protection • Based on harvested acres • CONS • Local yields vs. national yields • Regional weather MSIP Points
FAPRI • PROS • Favors areas with high yields and low yield variability • Paid on actual bushels produced • CONS • Paid on actual bushels produced (No crop = No payment) Loan Rate Summary
FAPRI • PROS • Best for grain, wheat, and rice • Greatest pass through of dollars from government to the farm sector • Frozen base and yields • CONS • Least protection in bad years • Frozen base and yields Market Loss Assistance Summary
FAPRI • Of the 3 counter-cyclical options, which worked best (based on national average net returns) for Highest AverageDown Side Risk • Rice MLA MSIP • Cotton MSIP MSIP • Wheat MLA MSIP • Corn MLA & SIP MSIP • Soybeans LR MSIP • Total Farm ?? ?? Consideration for Future Analysis
Flex-fallow Analysis Requested by Senators Harkin, Daschle, and Johnson FAPRI
Cash Receipts ’99 ($1,000) FarmName Crops Acres