Download
1 / 28
280 likes | 299 Vues
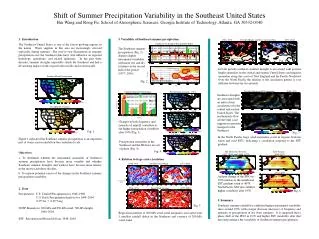
Trend and Variability of East-Asian Precipitation: Linkage to Sea Surface Temperatures. Fanglin Yang Environmental Modeling Center National Centers for Environmental Prediction NOAA 32 nd Climate Diagnostic and Prediction Workshop COAPS/FSU, October 22-27, 2007

E N D
Trend and Variability of East-Asian Precipitation: Linkage to Sea Surface Temperatures Fanglin Yang Environmental Modeling Center National Centers for Environmental Prediction NOAA 32nd Climate Diagnostic and Prediction Workshop COAPS/FSU, October 22-27, 2007 Acknowledgment: This work was support by the NASA Modeling, Analysis and Prediction program while the author worked with William Lau at GFSC/NASA.
Possible causes: • South Asian black carbon emission • Climate regime shift • Global warming • Shift of Africa-North China teleconncection • SST trend
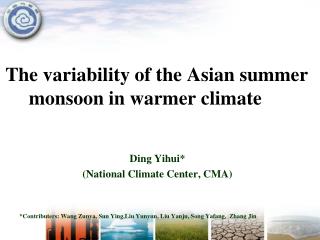
North China Central China South China
Questions? • To what extent can the observed precipitation variability can be explained by SST variability? • Does the precip-SST relation at the interannual timescale differ from that at the inter-decadal timescale?
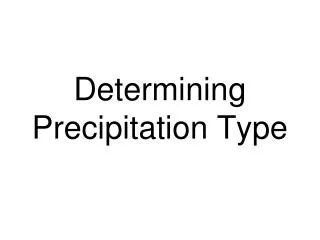
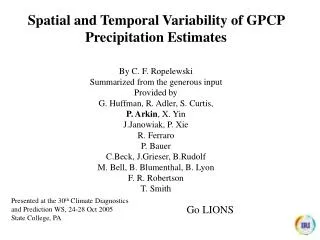
Interannual Variability Single Value Decomposition (SVD) applied to 7-year high-pass filtered precipitation and SSTs
MAM SST Precip
JJA SST Precip
SST Variance Precipitation Variance SST-Precipitation Co-Variance Correlation (PC_sst, PC_precip) MAM SVD 1 31% 27% 27% 0.57 SVD 2 11% 15% 14% 0.64 JJA SVD 1 43% 10% 24% – 0.77 SVD 2 7% 17% 13% 0.76
JJA, Regressions of wind850 and Z700 to PCs SVD Modes JJA Climate, 1951-1998, NCEP R1 SST_PC Precip_PC
MAM SST_PC Precip_PC
SST Interannual Mode
Area-Mean Rainfall Projection of Obs to SVD mode Rainfall Interannual Mode
Interannual Variability Precipitation over South China in MAM and North China in JJA ENSO mode of SSTs Precipitation over central China in both MAM and JJA season SST in warm pool and northern Indian ocean; Features of the anomalous 850-hPa winds and 700-hPa geopotential height corresponding to these modes support a physical mechanism that explains the causal links between the modal variations of precipitation and SSTs. Trend and decadal variation Upward South China MAM precipitation and downward JJA North China precipitation warming trend of the ENSO-like mode. Upward JJA central China precipitation warming trend of SSTs over the warm pool and Indian Ocean. Downward MAM South China precipitation downward central North Pacific SSTs (less robust) Conclusion