Download
1 / 117
1.17k likes | 1.2k Vues
Basic Ratio Analysis Part 1 – Concept of Financial Statement Analysis. Ratio Analysis. How to Evaluate the Performance of a Business?.

E N D
Basic Ratio AnalysisPart 1 – Concept of Financial Statement Analysis Ratio Analysis
How to Evaluate the Performance of a Business? • Your uncle is carrying a trade business. He knows you are studying business, accounting, and financial studies and asks if you could provide him with some ideas on the financial performance and position of his business. • Can you give him some advise?
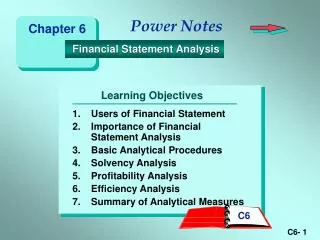
How to Evaluate the Performance of a Business? • Three basic aspects • Financial Status: is the company financially sound, solvent, or liquid? • Operational Efficiency: how successfully is the business being run? • Investment Potentials: how do the financial status and operational efficiency relate to investments of fund provider?
Financial Analysis • Financial analysis is about the use of accounting information to access the financial performance and financial position of a company in order to help management to make decisions on investment, operation and financing. • Therefore, it is important to understand the format and contents of the financial reports of a company.
Financial Reports • There are two major financial reports for a company: • Income statement • Statement of financial position • These reports can provide information for various users in making business decisions. Financial Reports
Users of Financial Reports • The users of financial reports can broadly be categorised as: • Resource providers (e.g. creditors, lenders, shareholders, employees). • Recipients of goods or services (i.e. customers, debtors). • Government departments/Regulatory bodies (e.g. Inland Revenue Department, Census and Statistics Department). • Internal management to assist in their decision-making capacity.
Income Statement • Purpose • Measure of profit / loss for a trading period. • Provide factors which have caused the profit / loss.
Income Statement • Presenting the revenues and expenses of a company for one year. • Layout of an income statement: Sales A Cost of Goods Sold B Gross Profit C = A – B Expenses D Net Profit E = C – D Major component: Sales: Income generated by the company Cost of Goods Sold: Cost that a company pays directly for the products sold/services rendered to customers Expenses: Expenditures that a business incurs as a result of performing its normal business operations
Activity 1 – Class Discussion • What can we know by reviewing a company’s income statement?
Activity 1 – Solution • An income statement indicates the amount of profits generated by a company over a given time period, i.e. 1 year. • By reviewing the income statement, we can understand the financial performance of a company in the following ways: • How much sales it generated for the year? • How much costs incurred for the production/merchandise of goods for the year? • What is the gross profit for the year? • How much a company spent on operation such as administrative cost, sales and marketing etc. for the year. • What is the net profit earned for the year?
Statement of Financial Position • The statement of financial position is a ‘snapshot in time’ which shows the financial health of the company. • It does not explain how well / poor the company has performed over the year.
Statement of Financial Position • Presenting the assets and liabilities of a business at a specific point in time i.e. end of the year. • Major components: • Assets • Fixed Assets – including land, buildings, equipment, motor vehicles etc. • Current Assets – including inventory, account receivable (money owing to the company), cash etc. • Liabilities • Non-current liabilities –those obligations the business has to meet beyond a year. E.g. long-term loan etc. • Current liabilities – those obligations the business has to meet within a year. E.g. account payables (money owed by the company). • Shareholders capital put into the business by the ‘owners’ • Paid-in capital/share capital – money contributed by the owners of the business. • Retained profit/loss – cumulative profit/loss from prior years after distributions to owners.
Activity 2 – Class Discussion • A company’s financial statements consist of the income statement and statement of financial position. Compare these two statements.
Basic Ratio AnalysisPart 2 – Concept and General Function of Accounting Ratios Ratio Analysis
Financial Statements Analysis • Financial statement analysis is a study of the relationship between Income Statement and Statement of Financial Position. • Financial Statement Analysis – helps users to understand the financial performance and financial position of a business so as to make business decisions.
Ability to meet short-term obligations and to efficiently generate revenues Ability to generate future revenues and meet long-term obligations Ability to provide financial rewards sufficient to attract and retain source providers Ability to generate positive market expectations Four Aspects of Financial Statements Analysis
Class Activity 1 – Class Discussion • Your uncle has then provided you with the income statement and statement of financial position of his business for the last two financial years (see next slide) for your viewing. • What can you find out from the information provided on the financial statements?
Purpose of Financial Statements Analysis Using Ratios What is ratios? • A ratio expresses the relationship between two numbers, e.g., a given ratio of A:B = 5:1 means A is 5 times B. • A ratio by itself may have no meaning. Therefore comparison is required. For example: • Compare the ratios of current year with last year. • Compare the ratios with other companies. • The use of ratios for financial analysis is a quantitative method to explain the financial performance and position of a company.
Purpose of Financial Statements Analysis Using Ratios • Ratios analysis is one of the popular ways to evaluate a company’s performance and financial position by using data from a company’s income statement, statement of financial position and certain market data. • It involves the expression of the reported numbers in relative terms rather than relying on the absolute numbers. • It can highlight the strengths and weaknesses of companies.
Comparative Analysis • Performance of a company cannot be determined by the amount presented on the financial statements alone. • The amount must be compared with other financial data to provide more relevant information for decision-making. • The following three types of comparisons can enhance decision making usefulness of financial information: • Intracompany comparison • Intercompany comparison • Industry averages comparison
Intracompany Comparison • Comparisons within a company are often useful for identifying changes in financial relationships and significant trends. • E.g. a comparison of a company’s current year’s cash amount with the prior year’s cash amount shows either an increase or a decrease in the company cash position.
Intercompany Comparison • Comparisons with other companies (e.g. competitors) provide an insight into a business’s competitive position. • Company can therefore make appropriate strategy in respond to its competitors. E.g. pricing strategy
Industry Averages Comparison • Comparisons with industry averages provide information about a business's relative position within the industry. • A business can understand its strengths and weaknesses in the industry. • E.g. compare the profit margin with the industry to see whether there is a good control on spending.
Class Activity 2 – Group Discussion • Divided into three groups which represent the 1. internal management; 2. lenders; 3. shareholders (investors) of a company and discuss how financial ratios can help each group to make business decisions.
Class Activity 2 – SolutionInternal Uses of Financial Ratios: • Financial ratios are internally used by • management to • Identify deficiencies of the company and take immediate remedial action such as poor control on costs. • Understand and compare the financial performance of different divisions, e.g. which product lines are more profitable than the others within a company. • employee to • Ensure job security. • Assess the potential for a pay rise.
Class Activity 2 – SolutionExternal Uses of Financial Ratios: Financial ratios are externally used by: • Lenders in deciding whether or not to provide loans to a company. • Investors (shareholders and debenture holders) in deciding whether or not to invest in a company e.g. buying the shares/debentures issued by the company. • Major suppliers in deciding to whether or not to provide credit to a company.
Basic Ratio AnalysisPart 3 – Calculation and Interpretation of Profitability Ratios(Gross Profit and Net Profit Margin) Ratio Analysis
Ratio Analysis • Key types of ratios: • Profitability ratios - to measure how profitable is its operating activities. • Liquidity ratios– to measure the ability of a business to meet its short-term debts. • Solvency ratios– to measure the ability of a business to meet its long-term debts. • Market Prospects (Investment) ratios– to measure the investment worthiness of the business. E.g. earnings per share or returns on investment.
Profitability Ratio • Measure the income or operating profit of an enterprise for a given period of time. The profitability of a company may affects: • its ability to obtain debt and equity financing; • its liquidity position; and • its ability to grow. Profits
Profitability Ratio • In the income statement, there are four levels of profit for analysis: • Gross profit • Net profit before interest and tax (or called operating profit) • Net profit before tax • Net profit after tax • Profitability ratio provides a comprehensive measure of a company’s profitability and enables comparison with its competitors and the industry average by using percentage.
Profitability Ratio Key Profitability Ratios • Gross Profit Ratio/Margin • Net Profit Ratio/Margin • Return on Capital Employed (ROCE)
Gross Profit Margin • Gross profit = Total sale revenue – COGS • The cost of goods sold is the cost of merchandise or the cost of services. • Gross profit margin shows the profitability of a company after considering its cost of sales and the ability to cover its operating expenses. • The formula:
Gross Profit Margin • The gross profit margin provides important information to management. • If it declines, the management may consider: • to increase selling price if possible • to reduce cost of sales e.g. find another supplier who can provide materials at lower cost.
Activity 1 – Calculation of Gross Profit Margin • Given the following information, calculate and comment the gross profit margin for the years of 20X4 and 20X5.
Activity 1 – Solution • Comment: The GP margin is better in 20X5 which indicates that there is a better control in purchase cost.
Net Profit Margin • Net profit = Total revenue – Total costs • This ratio shows a company’s ability to earn a net income from sales after deducting operating expenses. • This ratio serves as an overall measure of the company’s operating effectiveness. • The formula:
Net Profit Margin • Management concerns net profit margin as it provides information about the ability of the company to manage costs and expenses and generate profits. • A lower net profit margin may indicate poor control on operating expense.
Activity 2 – Calculation of Net Profit Margin • Given the following information, calculate and comment the net profit margin for the years of 20X4 and 20X5.
Activity 2 – Solution • Comment: The NP margin has declined in 20X5 which indicates that the company’s control in operating expense is poorer, making the % increase in operating expense exceeded the % increase in GP margin.
Basic Ratio AnalysisPart 4 – Calculation and Interpretation of Profitability Ratios(Return on Capital Employed) Ratio Analysis
Class Activity 1 – Class Discussion How are gross profit margin and net profit margin different from each?