Download
1 / 29
340 likes | 1.2k Vues
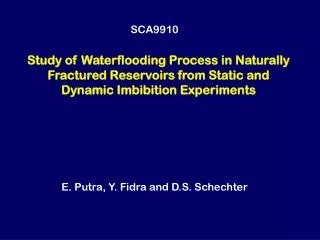
SCA9910. Study of Waterflooding Process in Naturally Fractured Reservoirs from Static and Dynamic Imbibition Experiments. E. Putra, Y. Fidra and D.S. Schechter . Outline. Introduction. Objectives. Static Imbibition. Dynamic Imbibition. Conclusions. Dynamic. Static . imbibition.

E N D
SCA9910 Study of Waterflooding Process in Naturally Fractured Reservoirs from Static and Dynamic Imbibition Experiments E. Putra, Y. Fidra and D.S. Schechter
Outline Introduction Objectives Static Imbibition Dynamic Imbibition Conclusions
Dynamic Static imbibition imbibition Determine laboratory critical injection rate Introduction Determine rock wettability Capillary Capillary pressure curve pressure curve Fracture Scaling Capillary equations Number Upscaling Upscaling Field dimension
Objectives • To investigate wettability of Spraberry Trend Area at reservoir conditions. • To investigate the contribution of the capillary imbibition mechanism to waterflood recovery. • To determine the critical water injection rate during dynamic imbibition.
Experimental Set-up for Static Imbibition Tests at Ambient Conditions
Side View Air Bath NV BV BV Brine Tank PR High Pressure core Imbibition Cell Graduate Cylinder BV N2 Bottle (2000 psi) Top View BV = Ball Valve NV = Needle Valve PR = Pressure Regulator Inlet for creating tangential flow Experimental Set-up for Static Imbibition Tests at Reservoir Conditions
Effect of Pressure and Temperature on Static Imbibition in Berea Sandstone
Effect of Temperature on Static Imbibition with Spraberry Reservoir Rock
Wettability index vs aging time for different experimental temperatures Static imbibition A Displacement B Spraberry cores
Composite Imbibition Curves 1.00 Aranofsky Eq. : 0.90 l R = 1 - exp (- t ) n D 0.80 0.70 SWW Berea Core (reference curve) 0.60 Normalized Recovery Spraberry Cores 0.50 at Reservoir Condition l = 0.0053 0.40 0.30 0.20 Spraberry Cores at Ambient Condition l = 0.0015 0.10 0.00 0.01 0.1 1 10 100 1000 10000 100000 Dimensionless Time, tD
Scaling Equations for Static Imbibition ; C = 10.66
Up-scaled Recovery Profile 1U h = 10 ft Ls = 3.79 ft Upper Spraberry 1U Formation (Shackelford-1-38A)
Effect of Matrix Permeability and Fracture Spacing on Oil Recovery
Static Imbibition Modeling Oil recovered Oil bubble Glass funnel Core plug Brine Governing Equation Assumptions No gravity effect Only Pc as driving force Fluid and rock are incompressible
Static Imbibition Modeling Match between Laboratory Experiment and Numerical Solution for Sor = 0.2 Capillary Pressure Curves Obtained as a Result of Matching Experimental Data
Counter-current Exchange Mechanism Matrix Fracture Invaded Zone Matrix Water Oil Fracture Concept of Dynamic Imbibition Process
Experimental Set-up for Dynamic Imbibition Tests at Reservoir Temperature Air Bath Confining pressure gauge Brine tank Core holder Graduated cylinder Artificially fractured core N2 Tank (2000 psi) Ruska Pump Fracture Matrix
Oil Recovery from Fractured Berea and Spraberry Cores during Water Injection using Different Injection Rates
Comparison between Static and Dynamic imbibitions for Berea Core, Spraberry Brine and Crude Oil
Dynamic Imbibition Modeling Single porosity, 2 phase and 3-D Rectangular grid block with grid size : 10 x 10 x 3 (Berea) ; z = 9 layers for Spraberry Fracture layer between the matrix layers Inject into the fracture layer Alter matrix capillary pressure only to match the experimental data zero Pc for fracture straight line for krw and kro fracture use krw and kro matrix from the following equations (Berea core):
Berea Core Match Between Experimental Data and Numerical Solution Cumulative oil production vs. time Cumulative water production vs. time Spraberry Core Cumulative water production vs. time Cumulative oil production vs. time
Capillary Pressure Curves Obtained by Matching Experimental Data (Berea and Spraberry Cores)
Viscous force (v w Af ) Capillary force ( cos Am) w h dz Am Af Dimensionless Fracture Capillary Number Lab Units: Field Units:
Conclusions The capillary pressure curve and wettability index obtained from spontaneous imbibition experiments indicate the Spraberry cores are weakly water-wet. • Effect of pressure is much less important than the effect of temperature on imbibition rate and recovery. Performing the imbibition tests at higher temperature results in faster imbibition rate and higher recovery due to change in mobility of fluids.
Conclusions (Cont’ed) The capillary pressure curve obtained from dynamic imbibition experiments is higher that of the static imbibition experiments due to viscous forces during the dynamic process. An effective capillary pressure curve can be derived from dynamic imbibition experiments as a result of matching between experimental data and numerical solution. Imbibition transfer is more effective for low injection rates due to lower viscous forces and longer time to contact the matrix.