
I / I -60
Figure S1. I / I -60. 1.4. 1.0. 0.6. 0.2. 0. -80. -40. +40. +80. Conditioning potential (mV).

I / I -60
E N D
Presentation Transcript
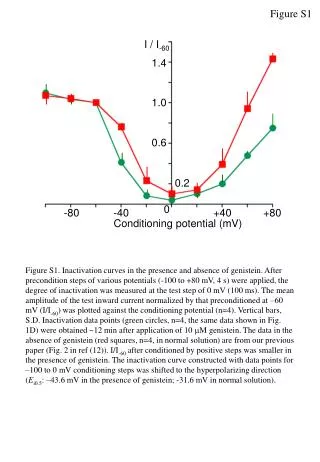
Figure S1 I / I-60 1.4 1.0 0.6 0.2 0 -80 -40 +40 +80 Conditioning potential (mV) Figure S1. Inactivation curves in the presence and absence of genistein. After precondition steps of various potentials (-100 to +80 mV, 4 s) were applied, the degree of inactivation was measured at the test step of 0 mV (100 ms). The mean amplitude of the test inward current normalized by that preconditioned at –60 mV (I/I-60) was plotted against the conditioning potential (n=4). Vertical bars, S.D. Inactivation data points (green circles, n=4, the same data shown in Fig. 1D) were obtained ~12 min after application of 10 M genistein. The data in the absence of genistein (red squares, n=4, in normal solution) are from our previous paper (Fig. 2 in ref (12)). I/I-60 after conditioned by positive steps was smaller in the presence of genistein. The inactivation curve constructed with data points for –100 to 0 mV conditioning steps was shifted to the hyperpolarizing direction (Ei0.5: –43.6 mV in the presence of genistein; -31.6 mV in normal solution).