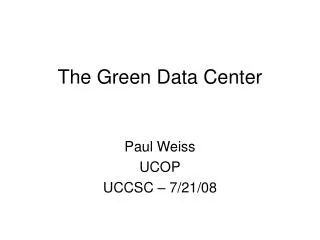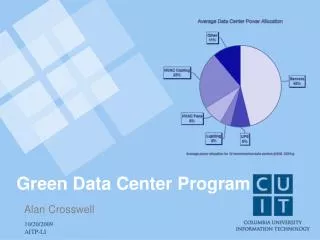
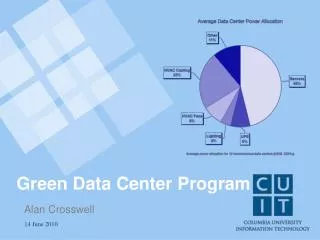
Green Data Center Program
Alan Crosswell. Green Data Center Program. Agenda. Welcome to Columbia University The opportunities Status of the main University Data Center and others around campus Green data center best practices Our NYSERDA advanced concepts datacenter project Measurement challenges.

Green Data Center Program
E N D
Presentation Transcript
Alan Crosswell Green Data Center Program
Agenda Welcome to Columbia University The opportunities Status of the main University Data Center and others around campus Green data center best practices Our NYSERDA advanced concepts datacenter project Measurement challenges
Welcome to Columbia University in the City of New York King’s College est. 1754 (renamed Columbia in 1784) Colors: Light Blue & White. Mascot: the Columbia lion Located in Morningside Heights since 1897 CU Medical Center in Washington Heights Lamont-Doherty Earth Observatory in Palisades, NY Nevis Laboratories in Irvington, NY expanding to 17-acre Manhattanville area of West Harlem new Global Centers in Amman, Beijing 16 graduate, professional and undergraduate colleges 3,500+ faculty (79 Nobel laureates, 104 NAS members) 25,450+ students (7,500+ undergraduate; 23% international) Columbia College Today. Jan/Feb 2010
Columbia Green Lion Pride Office of Environmental Stewardship est. 2006 Over 30 environmental academic programs and centers Green initiatives in: Housing (buildings, recycling/reuse, energy, etc.): Eco-Reps Dining (local food, no trays, containers, food donation, etc.) Facilities (5 LEED buildings, conservation, energy, recycling, etc.) Manhattanville campus development (LEED, materials recycling, etc.) IT (data center, desktop procurement & management, student outreach)
Faculty House McKim, Mead & White architects. Built in1920s. Renovated in 2008-9. Awarded USGBC LEED Gold certification, April 19, 2010. First McKim, Mead and White building nationally to obtain LEED certification. First LEED Gold certified building on Morningside campus.
The opportunities Data centers consume 3% of all electricity in New York State (1.5% nationally as of 2007). That’s 4.5 billion kWh annually. Use of IT systems especially for research high performance computing (HPC) is growing. We need space for academic purposes such as wet labs, especially in our constrained urban location. Columbia’s commitment to Mayor Bloomberg’s PlaNYC 30% carbon footprint reduction by 2017. NY State Gov. Paterson’s 15x15 15% electrical demand reduction by 2015. US Save Energy Now 25% energy intensity reduction in 10 yrs.
Main university data center Architectural Built in 1963, updated somewhat in the 1980's. 4400 sq ft raised floor machine room space. 1750 sq ft additional raised floor space, now offices. 12” raised floor Adequate support spaces nearby Staff Staging Storage Mechanical & fire suppression (future) UPS room 1968 2009
Main university data center Electrical Supply: 3-phase 208V from automatic transfer switch. Distribution: 208V to wall-mounted panels; 120V to most servers. No central UPS; lots of rack-mounted units. Generator: 1750 kW shared with other users & over capacity. No metering. (Spot readings every decade or so:-) IT demand load tripled from 2001-2008
Main university data center Bruns-Pak, Inc.
Main university data center Mechanical On floor CRAC units served by central campus chilled water. Also served by backup glycol dry coolers. Supplements a central overhead air system. Heat load is shared between the overhead and CRAC. No hot/cold aisles. Rows are in various orientations. Due to tripling of demand load, the backup (generator-powered) CRAC units lack sufficient capacity.
IT systems A mix of mostly administrative (non-research) systems. Most servers dual-corded 120V power input. Many old (3+, 5+ years) servers. Due to lack of room UPS, each rack has UPSes taking up 30-40% of the space. Lots of spaghetti in the racks and under the floor. Main university data center
Other data centers around Columbia Many school, departmental & research server rooms all over the place. Range from about 5,000 sf … to tiny (2-3 servers in a closet) Several mid-sized Most lack electrical or HVAC backup. Many could be better used as labs, offices, or classrooms. Growth in research HPC putting increasing pressure on these server rooms. Lots of money spent building new server rooms for HPC clusters that are part of faculty startup packages, etc.
Green data center best practices • Measure and validate • You can’t manage what you don’t measure. • Power and cooling infrastructure efficiency • Best Practices for Datacom Facility Energy Efficiency. ASHRAE (ISBN 978-1-933742-27-4) • IT equipment efficiency • Moore’s Law performance improvements • Energy Star power supplies • BIOS and OS tuning • Application tuning
Measuring infrastructure efficiency • The most common measure is Power Use Efficiency (PUE) or its reciprocal, Data Center Infrastructure Efficiency (DcIE). [Total Datacenter Electrical Load] PUE = [Datacenter IT Equip. Electrical Load] • PUE measures efficiency of the electrical and cooling infrastructure only. • Chasing a good PUE can lead to bizarre results since heavily-loaded facilities usually use their cooling systems more efficiently.
LBNL Average PUE for 12 Data Centers Power Use Efficiency (PUE) =2.17
Making the server slice bigger, the pie smaller and green. • Reduce the PUE by improving electrical & mechanical efficiency. • Google claims a PUE of 1.2 • A “good” PUE for a conventional data center is around 1.8 • Consolidate data centers (server rooms) • Claimed more efficient when larger (prove it!) • Free up valuable space for wet labs, offices, classrooms. • Reduce the overall IT load through: • Server efficiency (newer, more efficient hardware) • Server consolidation & sharing • Virtualization • Shared research clusters • Move servers to a zero-carbon data center
Data center electrical best practices • 95% (or better) efficient 480V room UPS • Basement UPS room vs. wasting 40% of rack space • Double-conversion on-line vs. off-line. • Flywheels or batteries? • 480V distribution to PDUs at ends of rack rows • Transformed to 208/120V at PDU • Reduces copper needed, transmission losses • 208V power to servers vs. 120V • More efficient (how much?) • Variable Frequency Drives for cooling fans and pumps • Motor power consumption increases as the cube of the speed. • Generator backup
Data center mechanical best practices • Air flow – reduce mixing, increase delta-T • Hot/cold or double hot aisle separation • 24-36” under floor plenum • Plug up leaks in floor and in racks (blanking panels) • Duct CRAC returns to an overhead plenum if possible • Perform CFD modeling • Alternative cooling technique: In-row or in-rack cooling • Reduces or eliminates hot/cold air mixing • More efficient transfer of heat (how much?) • Supports much higher power density • Water-cooled servers are making a comeback
Data center green power best practices • Locate data center near a renewable source • Hydroelectric power somewhere cold like Western Mass. • Wind power – but most wind farms lack transmission capacity. • 40% of power is lost in transmission. So bring the servers to the power. • Leverages our international high speed networks • Use “free cooling” (outside air) • Stanford facility will free cool almost always • Implement “follow the Sun” data centers • Move the compute load to wherever the greenest power is currently available.
General energy saving best practices • Efficient lighting, HVAC, windows, appliances, etc. • LBNL and other nations’ 1W standby power proposals • Behavior modification • Turn off the lights! • Enable power-saving options on computers • Social experiment in Watt Residence Hall • Co-generation • Waste heat is recycled to generate energy • Planned for Manhattanville campus • Possibly for Morningside campus • Columbia participation in PlaNYC
Measuring IT systems efficiency • A complementary measure to PUE is the amount of useful work being performed by the IT equipment. • How do we define “useful”? What should the metric be? • MIPS per KwH? (MIPS = meaningless indicator of processor speed) • kilobits per MWh (an early NSFNet node benchmark:-) • Green Computing Performance Index (from sicortex) for HPCC: GCPI = n(HPCC benchmarks)/kW • n = 1 for Cray XT3 • Uses a “representative” suite of HPCC benchmarks • SPECpower • Server-side Java ops per watt
Barriers to implementing best practices • Capital costs • Perceived or actual grant funding restrictions • Short-term and parochial thinking • Lack of incentives to save electricity • Distance • Synchronous writes for data replication are limited to about 30 miles • Bandwidth × Delay product impact on transmission of data • Reliability concerns • Server hugging • Staffing needs
ECAR: Powering Down: Green IT in Higher Education • Surveys 261 higher education institutions • Cites Columbia’s environmental sustainability efforts and NYSERDA’s role
Our NYSERDA project New York State Energy Research & Development Authority is a public benefit corporation funded by NYS electric utility customers. Columbia competed for and was awarded an “Advanced Concepts Datacenter demonstration project.” 24 months starting April 2009. ~$1.2M ($447K direct costs from NYSERDA) Goals: Learn about and test some industry best practices in a “real world” datacenter. Measure and verify claimed energy efficiency improvements. Share our learnings with our peers. Visit our blog at http://blogs.cuit.columbia.edu/greendc
Our NYSERDA project – specific tasks Identify 30 old servers to consolidate and replace. Instrument server power consumption and data center heat load in “real time” with SNMP. Establish PUE profile (use DoE DC Pro survey tool). Implement 9 racks of high-density cooling (in-row/rack). Implement proper UPS and higher-voltage distribution. Compare old & new research clusters' power consumption for the same workload. Implement advanced server power management and measure improvements. Review with internal, external and research faculty advisory groups. Communicate results.
Wattnode meters Campus Level power panel CRAC unit Data Center: 200 Level Flexim meters chilled water pipes Mechanical Room: 100 Level Main IT power feed (ATS4) server rack Raritan Power Distribution Units (PDUs) and Uninterruptible Power Supplies (UPSs)
Measuring power consumption • Measure power use with SNMP at: • Main electrical feeder, panels, subpanels, circuits. • UPSes • Power strips • Some servers • Chassis and blade power supplies SNMP instrumented power strip SNMP Modbus Inductive current transformer
Measuring power consumption • Use SNMP which enables comparison with other metrics like CPU utilization. Liebert GXT UPS (1 of 5 supporting an 800 core cluster) Raritan power strip
Measuring heat rejection thermostats • Data Center chilled water goes through a plate heat exchanger to the campus chilled water loop. • Measure the amount of heat rejected to the campus loop with temperature & flow meters to determine BTUh. • These also use Modbus. hydrosonic flow meter
Measuring IT efficiency • Run some HPC benchmarks. • Correlate IT and electrical data with SNMP. • Make a change and measure again to assess. Sum of primes 2:15,000,000 on 256 cores
SPECpower benchmark • Industry standard benchmark to evaluate performance and power • Addresses the performance of server side Java • Finds maximum ssj_ops (server side Java operations per second) • With simultaneous power measurement, allows calculation of ssj_ops / watt (performance per watt) • Licensed SPECpower from SPEC.org but results are not official SPEC benchmarks.
SPECpower results – HP DL360G4p On some systems, power consumption decreases as load decreases.
SPECpower results – Sun Sunfire V880 On other systems, constant power consumption regardless of load.
HPC Cluster comparison • Can a new, larger research cluster be more energy efficient than an older, smaller research cluster? Beehive Hotfoot
Beehive Built in 2005 16 cores 8 servers Dual-core 2.2 GHz AMD Operton 2 to 8 GB RAM 10 TB SATA storage OpenPBS scheduler Theoretical Peak GFlops: 61.6 IDLE POWER IN WATTS: 2.7 kW Hotfoot Built in 2009 256 cores 16 high-density blades (2 servers each) Dual quad-core 2.66 GHz Intel Xenon 16 GB RAM 30 TB SATA storage Condor scheduler Theoretical Peak GFLops: 1361.9 IDLE POWER IN WATTS: 4.1 kW The clusters
Comparison plan • Power use in active idle state • Beehive = 2.7 kW • Hotfoot = 4.1 kW • Energy consumption at load • Counting to one billion • Summing primes from 2 to 2 million (MPI) • Summing primes from 2 to 15 million (MPI)
Energy use while running jobs New cluster uses less energy to run research jobs than old cluster.
Measurement Challenges • Apparent vs. Real power • Impact of Power Factor (PF) and PF correction. • Relationship to UPS and server power supply efficiency. • How to get useful numbers from monitoring equipment (e.g. power-in vs. power-out of a UPS). • Phase imbalance and other confusion stemming from use of 3-phase power systems and how that affects measurements and efficiency. • Where best to meter while not blowing the budget. • Built-in server metering doesn’t always support SNMP monitoring.
Thank you This work is supported in part by the New York State Energy Research and Development Authority (NYSERDA agreement number 11145). NYSERDA has not reviewed the information contained herein, and the opinions expressed do not necessarily reflect those of NYSERDA or the State of New York.