SECOND ORDER MODELLING OF COMPOUND OPEN CHANNEL-FLOWS
260 likes | 603 Vues
SECOND ORDER MODELLING OF COMPOUND OPEN CHANNEL-FLOWS. L aboratoire de M odélisation en H ydraulique et E nvironnement. Prepared by : Olfa DABOUSSI Presened by Zouhaïer HAFSIA. Plan. Introduction. Secondary currents in compound open channel flow. Experimental results.

SECOND ORDER MODELLING OF COMPOUND OPEN CHANNEL-FLOWS
E N D
Presentation Transcript
SECOND ORDER MODELLING OF COMPOUND OPEN CHANNEL-FLOWS LaboratoiredeModélisationenHydrauliqueetEnvironnement Prepared by : Olfa DABOUSSI Presened by Zouhaïer HAFSIA
Plan Introduction. Secondary currents in compound open channel flow. Experimental results. Turbulence model. Numerical results. Conclusions.
INTRODUCTION After strong rain. The compound channel is composed from many stages. In laboratory, compound channel are represented by the main channel and one floodplain with rectangular sections. It is interesting to study the compound channel flow to understand main channel – floodplain interaction. The turbulence model : second order model Rij. We use the CFD code PHOENICS for numerical simulations. Numerical results are compared to experimental data of Tominaga and al. (1989).
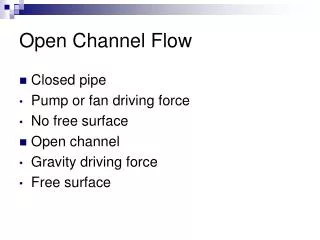
THE RECTANGULAR OPEN COMPOUND CHANNEL FLOW I – Rectangular compound channel Symmetric Asymmetric Free surface
II – Tested cases Three cases of βvalues are simulated (Mesures of Tominaga and al., 1989). β = 0.5 β = 0.242 β = 0.343 λ = 2.07
NUMERICAL SIMULATIONS I – Governing Equations In incompressible Newtonian fluid and parabolic flow through the z direction, the Reynolds stress turbulence model of Launder and al. (1975) is written as : - Continuity : - Momentum :
- Kinetic equation : - εequation : - Reynolds stress : i, j, k = 1, 2, 3
C1, C2 and Cs are constants. - Boundary conditions : - Smooth wall logarithmic law : - Near walls, k , εand Rij are : - The free surface is considered as a symmetric plane : - On the vertical symmetric plane :
I – In PHOENICS There are four derivations of the Rij model : IPM, IPY, QIM and SSG. Where : • IPM is the Isotropisation of production model. • IPY is the IPM model of Younis (1984). • QIM is the quasi-isotropic model • SSG is the model of Speziale, Sarkar and Gatski PHOENICS use the finite volume numerical method.
PHOENICS take the z axis as the main flow direction for the parabolic ones. The cell along z is a slab. The general form of the transport equations is :
RESULTS OF SIMULATIONS k-ε model : Using the CFD code PHOENICS, we have tested two cases for β = 0.5. Results with coarse grid : The k- can not reproduce the isovelocity bulging shown experimentally
Results with thin grid : k- do not reproduce the isovelocity bulging The k-ε model is isotropic. Experience shows a strong anisotropy The second order model Rijtake account of the turbulence anisotropy.
Results with the Rij model: The four derivations of Rij give the same results. • Secondary currents : Free surface vortex Main channel vortex
Tranversal velocity profils on X = 0.087 m : = 0.5 on X = 0.055 m : = 0.5 on X = 0.101 m : = 0.5
Longitudinal velocity variations : Vertical averaging of the velocity : β = 0.5 Wall law at X = 0.02 m : β = 0.5
Comparaison of numerical isovelocity with Tominaga et al. (1989) data : β = 0.5 The Rij model reproduce well the isovelocity.
Wall shear stress variation : The shear stress on the floodplainraises near the main channel- floodplain junction. Momentum transfer from the main channel to the floodplain.
THE ADIMENSIONAL DISPERSION COEFFICIENT The adimensional dispersion coefficient appears after integration of the momentum equation through the transversal section. Needs a closure law Two approches : Gradient closure : Correlation based on the momentum distribution
Calculations show that α is different from 1. It depends of :from 1.04 to 1.35 Whith λ = 2.07, α varies as second degreespolynomialin function of as follow : α variation in function of β :
CONCLUSIONS Secondary currents modify longitudinal iso-velocity. The first order k-ε model do not reproduce the isovelocity bludging The second order turbulence model can reproduce the interaction between the main channel and flood-plain (momentum transfer) Numerical computation show that the dispersion coefficient α is expressed as a polynomial function of β
THANKYOU THANKYOU