Quadratic Regression
130 likes | 368 Vues
Learn how quadratic regression can model real-world data with examples, steps, equations, and applications in various contexts.

Quadratic Regression
E N D
Presentation Transcript
Lots of real word phenomena can be modeled with a quadratic function. You’ve seen this with the path of a football. What are some more real life examples of parabolas?
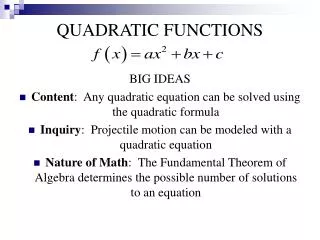
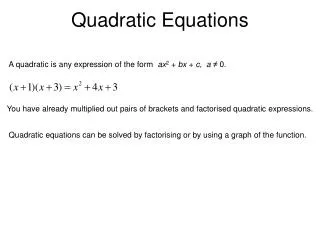
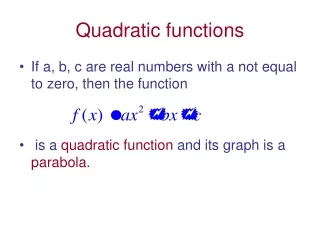
Quadratic Regression We can use our calculators to find a quadratic equation that models real-life data. This equation is called a quadratic regression.
Quadratic Regression Steps • STAT → Edit… Enter the data in L1 and L2. • STAT → CALC → QuadReg (Don’t hit Enter) • VARS → Function → Y-Vars → Y1 • Enter You now have a quadratic regression! If you look in Y1, your calculator has entered the equation for you!
Example 1 The table shows the monthly sales (thousands) for a new hair salon since its grand opening in March. 1) Find the best fitting quadratic model. 2) What will the total sales be 7 months after opening?
Example 2 The table shows the height of a model rocket after it is fired upwards from the ground. 1) Find the best fitting quadratic model. 2) When does the rocket hit the ground?
Example 3 The table shows the rate of oxygen consumed by an athlete running at a speed of 16 km/h using various stride lengths. 1) Find the best fitting quadratic model. 2) What is the vertex of the model? What does it mean to the runner?